Resources
3. The Ride Can Get Rough
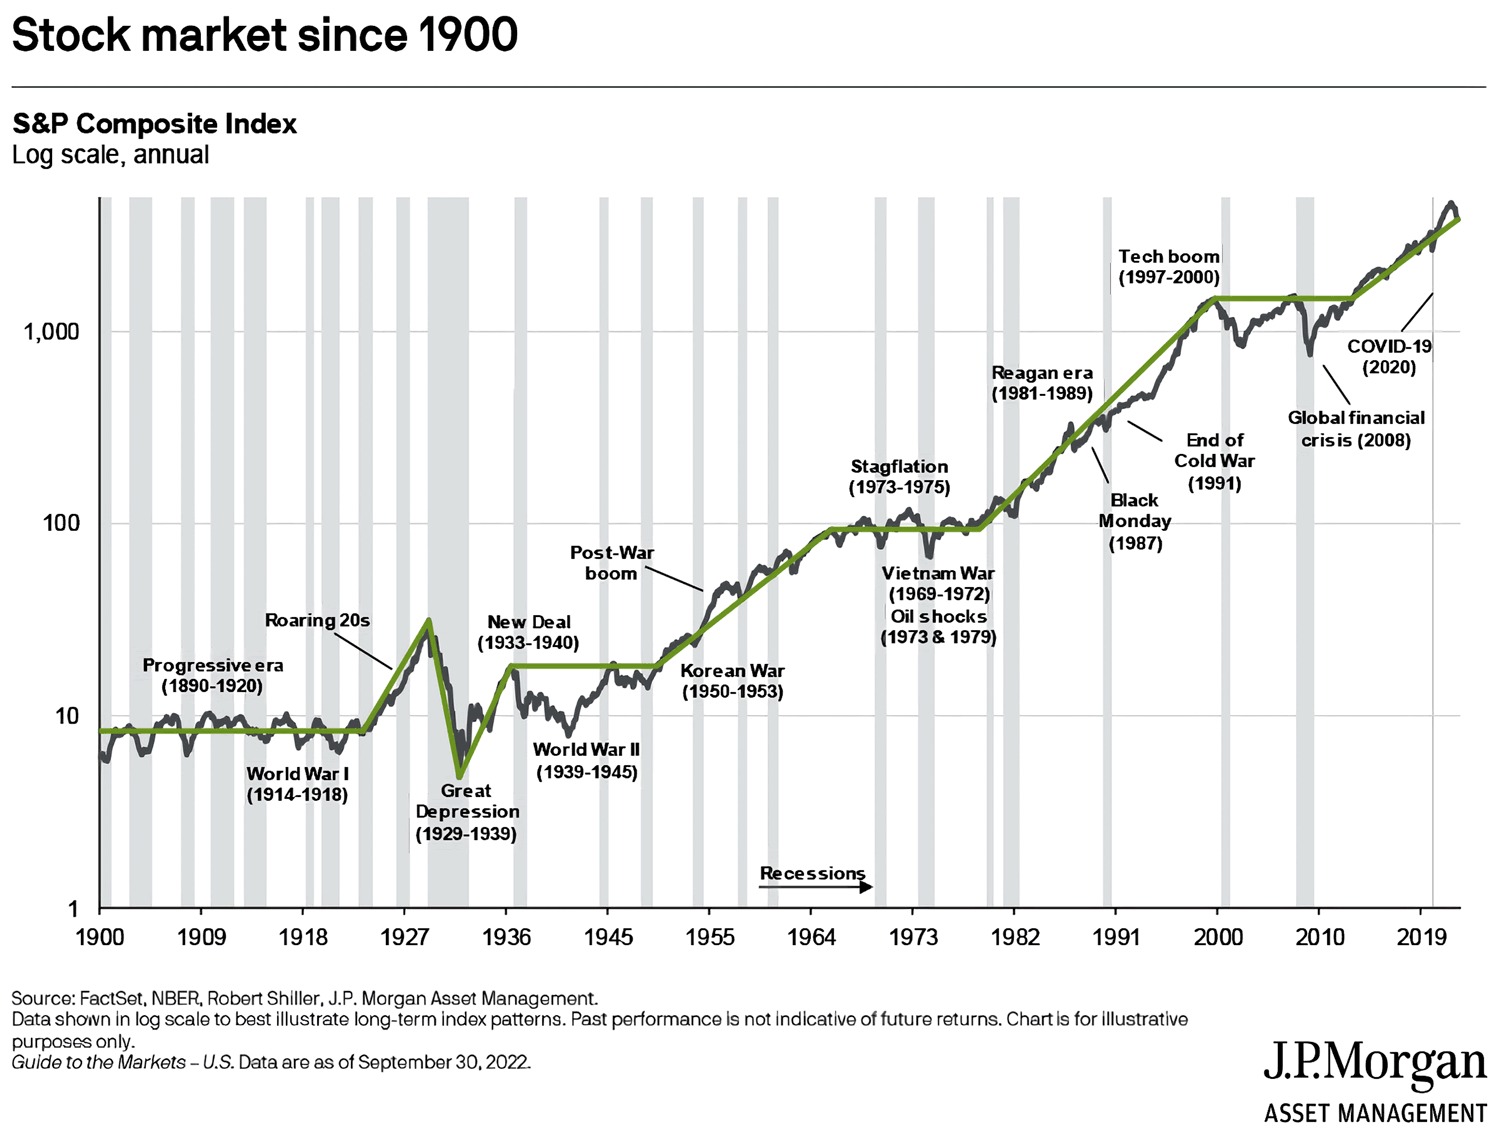
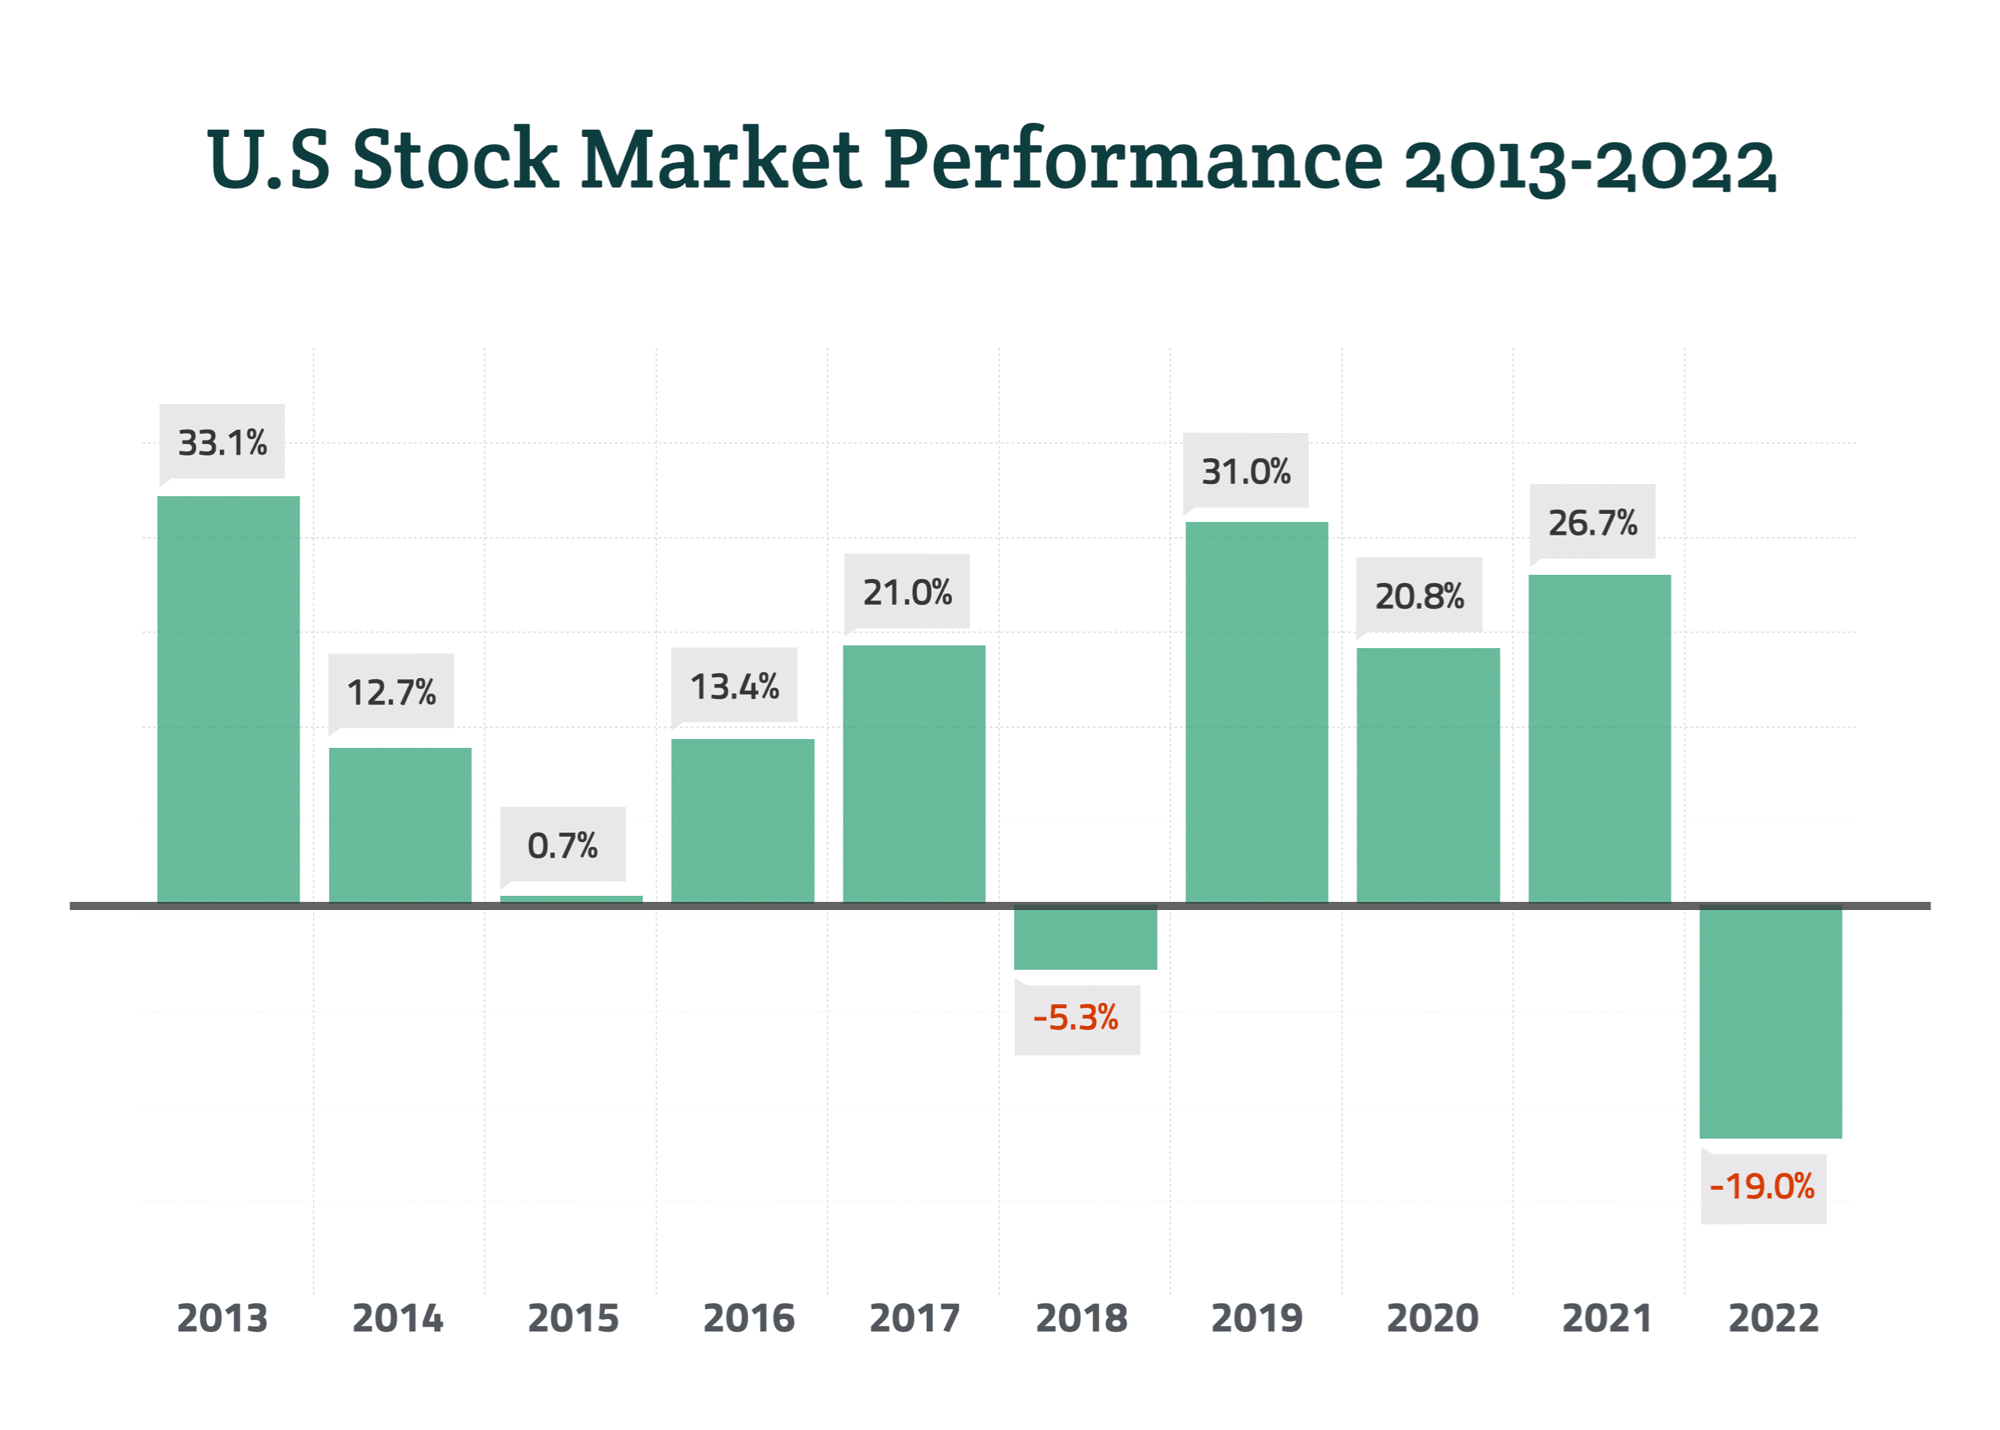
The chart we just looked at is nice and clean, showing a smooth, straight upward path for investment returns. While the stock market's long-term trend is upward, its actual path is neither smooth nor straight. Instead, that path is marked by many twists and turns, with some scary downturns thrown in for good measure!
Counting on a 7% average annual return is, in our view, realistic. (SMI's primary strategies have earned better returns than that in the past.) However, your rate of return isn't guaranteed, nor will you get 7% every year. Some years you'll do better (even much better!), and some years you'll do worse. In fact, in some years you may lose money.
So, before you start your investing journey, accept that the terrain will get rough from time to time.


Annual returns shown above are based on the Wilshire 5000, the broadest measure of the U.S. stock market.
