

Last month, we began a discussion of the stock market’s valuation by focusing on a pair of ratios that help determine where stocks sit on the spectrum between “cheap” and “expensive.” We first looked at the Price/Sales ratio (P/S), then expanded that conversation into a discussion of the often-used Price/Earnings ratio (P/E).
We concluded that discussion by pointing out that while these metrics can be helpful, the signals they generate can become confusing when the economy expands or contracts rapidly, as often occurs around recessions.
As an example, we noted that earnings projections for 2024 seem quite optimistic, given the decent probability of an economic slowdown or recession due to the rapid interest rate increases experienced over the past 12-18 months.
If those optimistic projections are met, today’s forward Price/Earnings ratio doesn’t look terribly high. But if they aren’t met and earnings come in significantly lower, today’s forward P/E ratio is likely giving investors a false sense of security.
CAPE Ratio
A primary takeaway of last month’s article was to point out how relying on short-term data — either past or future — can lead to significant variation in P/E ratios and the message these ratios signal regarding market valuation.
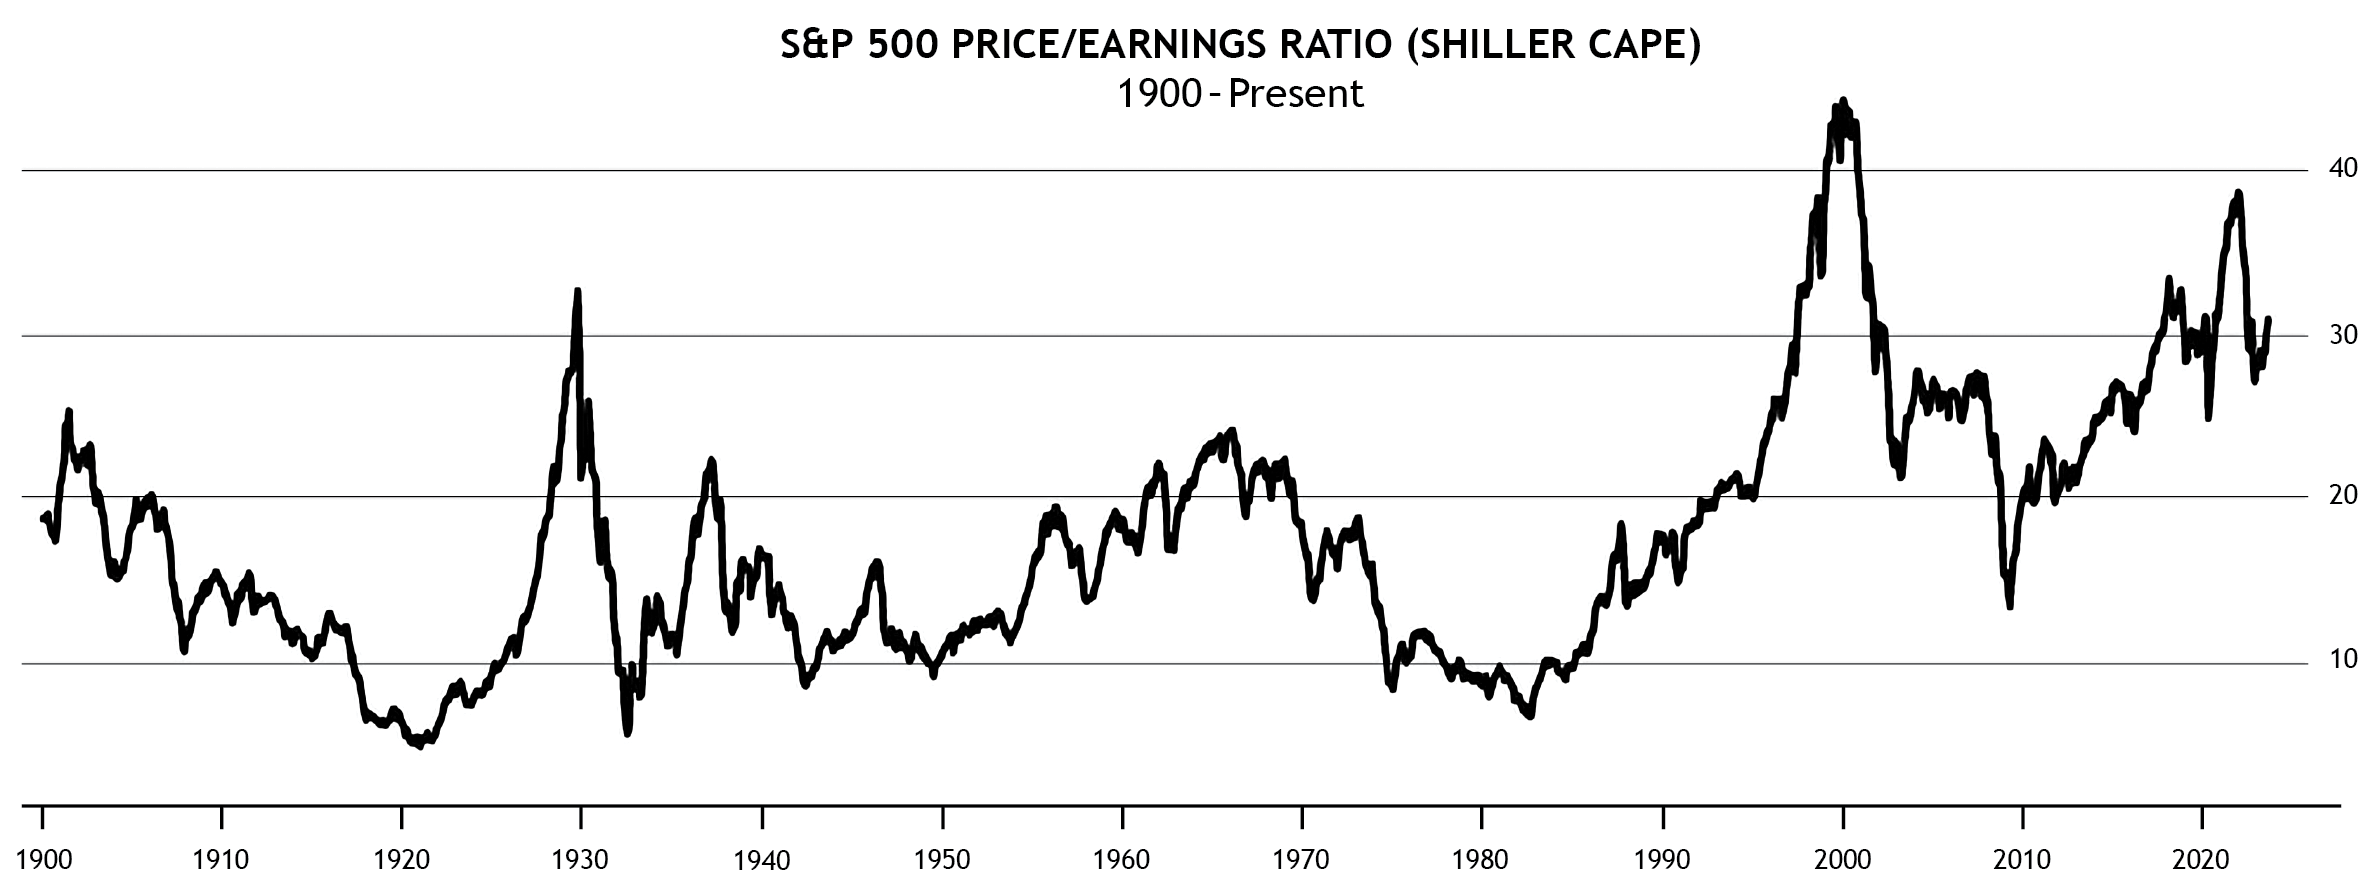
In an effort to filter out some of this short-term “noise” in calculating P/E ratios, economist Robert J. Shiller popularized an alternate P/E calculation based on the earnings of the index over the past 10 years. This “Cyclically Adjusted PE,” or CAPE ratio, smooths out the impact of recessions, bull/bear market excesses, and other short-term fluctuations.
While traditional P/E ratios have generally failed to show any predictive power in terms of the stock market’s performance, CAPE has a better track record, particularly when the CAPE ratio reaches historically extreme readings. When the CAPE has reached extreme highs, the market has tended to perform poorly over the next several years. On the flip side, when CAPE has been at historically low extremes, stocks have produced outstanding future returns.
That said, it’s critical to understand that CAPE tells us little about how the stock market will perform in the near term.
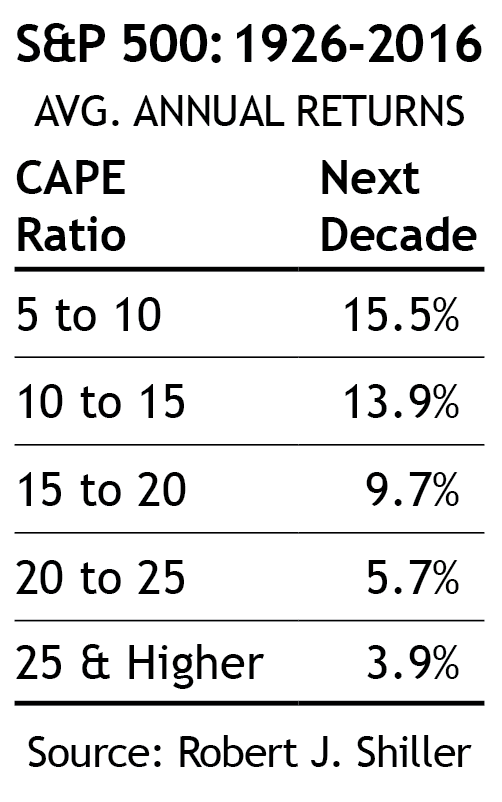
Its predictive power has been meaningful only over longer time periods. Studies have found predictive power from CAPE over periods ranging from 7-12 years out, so not surprisingly, it’s become common to discuss CAPE in terms of the decade that follows a particular reading.
The nearby table shows how cleanly market valuation, as measured by CAPE, predicted future market performance for the nine decades leading up to the 2008 Financial Crisis. When the market’s CAPE ratio was high (i.e., the market was relatively expensive), future returns were low and vice versa. In 2020, Advisor Perspectives ran an article by Michael Finke, Ph.D., concluding that CAPE has explained 85% of the variation in future stock returns since 1975, and 70% since 1940.
However, the years following the 2008 Financial Crisis have weakened the case for CAPE’s long-term predictive power. As the chart below shows, the CAPE ratio fell as low as 13.3 at the March 2009 market bottom and stayed below 25 through the end of 2013.
We don’t have 10-year returns yet for the period following 2013. But the 10-year returns for the 2010-2013 period, when the CAPE ratio was regularly between 20-25, were significantly higher than the 1926-2016 table would suggest. Over the four-year period from 2010-2013, the CAPE averaged 21.8 and the subsequent 10-year total return of the S&P 500 averaged +13.7%.
As with so many market “anomalies” from the 2010 central banking experiment with near-zero interest rate policy and quantitative easing, it’s impossible to say yet if this experience was truly an outlier. If so, CAPE’s former predictive ability may well return. If not, it may represent a continuation of the clear trend toward higher valuations seen since 1980 in most valuation metrics.
Click to zoom
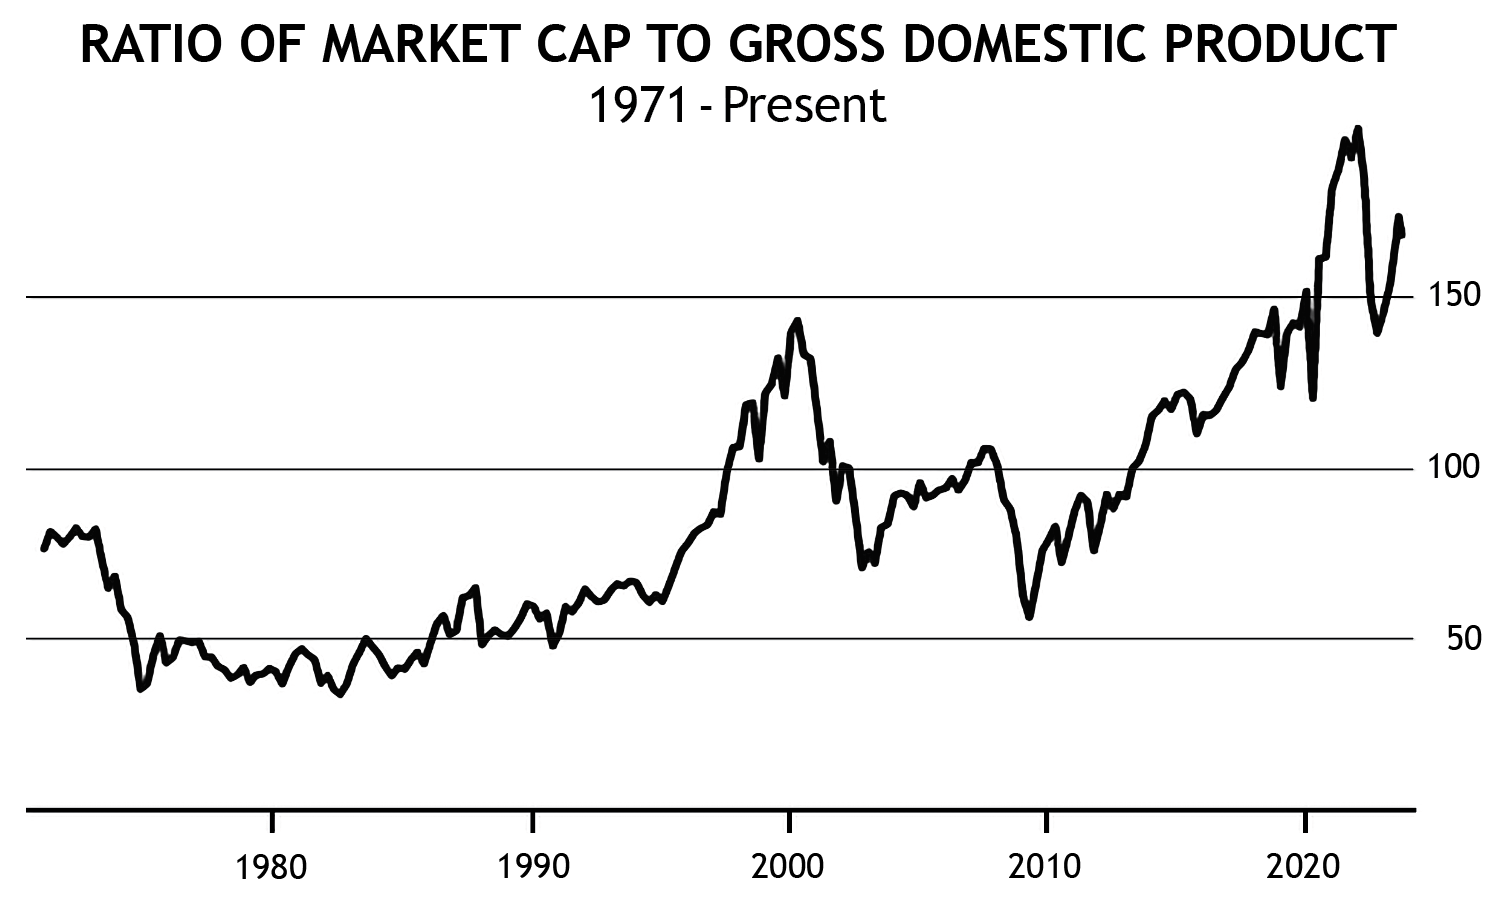
“Buffett Indicator” (Mkt Cap / GDP)
One of Warren Buffett’s favorite indicators compares the ratio of total U.S. market cap relative to the U.S. GNP (gross national product). Translating that, it’s a simple measure of the total price of the whole stock market compared to the size of the current economy. Buffet has said this is “probably the best single measure of where valuations stand at any given moment.”
As the graph below shows, this measure of market valuations got wildly disconnected from the growth of the underlying economy during the latter half of the 1990s. That excess was corrected by a pair of bruising -50% bear markets in the decade that followed.
Click to zoom
This indicator then climbed steadily toward the 150% level that had marked the peak of the early 2000 dot-com bubble, reaching that level immediately prior to 2020’s COVID market crash. After correcting for a month in March 2020, the stimulus-driven market euphoria that followed sent stock values to unprecedented levels relative to the underlying economy. The Buffett Indicator exploded to 199% in December 2021 before collapsing during last year’s bear market.
Still, despite last year’s significant correction lower, the Buffett Indicator stands at 167% today. That’s higher than its pre-COVID peak, as well as the early-2000 dot-com peak (both of those peaked around ~150%). The only time stocks have ever been more expensive than today by this measure was the 18-month COVID stimulus bull market in 2020-21.
Planning with valuations in mind
Perhaps the most important takeaway from this article is the warning that valuations are not an effective short-term timing tool. Stocks can, and do, stay at overvalued (or undervalued) levels for extended periods of time. Perhaps the best recent example of this was the infamous “Irrational Exuberance” speech delivered by then-Fed Chairman Alan Greenspan in December 1996. Correctly identifying the inflating stock market bubble, Greenspan’s warning was nonetheless more than three years early, as the market would continue to soar higher until peaking in March 2000.
However, the longer-term predictive record of the indicators discussed this month shouldn’t be dismissed. While valuations have been trending higher over recent decades, there’s no denying the past five years have been rarified air for market valuation. Knowing that the normal historical pattern has been for such high valuations to produce sub-par returns over the following decade or so leads to the following conclusions.
First, the idea that last year’s bear market was enough to reset valuations is clearly false, as demonstrated by the graphs above. The CAPE ratio is back to roughly the level it was pre-COVID (30.8 today vs. 31.0 in January 2020) — a level attained after a remarkable 11-year bull market ascent that included no formal bear markets or recessions. The Buffett Indicator looks even worse: today’s reading of 167.3 is well above the January 2020 peak of 152.3.
Second, and likely more valuable, you can use today’s high valuations as a check on the assumptions embedded in your financial planning. Knowing that today’s high valuations imply below-average returns over the decade ahead, you can use more conservative return estimates in your retirement projections.
It’s easy to reduce the future return estimates in the MoneyGuide planning software many SMI members use. Such planning adjustments can help you home in on decisions you may need to make today as a result, such as boosting your savings rate, adjusting your retirement date expectations, and so on. We strongly suggest running what-if scenarios based on below-average returns over the next decade. Better to plan for lower returns and be pleasantly surprised than to assume returns will be normal and be blindsided by the type of future returns today’s valuations suggest.
Finally, history indicates that periods of lower future returns following high market valuations rarely come about because the stock market merely drifts sideways for an extended period of time. When valuations increase to extreme levels, it’s typically bear markets that bring them back to earth. Afterward, the subsequent bull market raises prices, but only enough to generate the poor average returns that have characterized such periods in the past. So while we’d like to take a break from watching for a continuation of last year’s bear market (or another separate one in the not-too-distant future), history suggests remaining vigilant is both wise and appropriate.