
I’ve written increasingly over the past 18 months or so about similarities the current market has with the market of the late 1990s. No two periods are ever exactly the same, but when you’ve done this long enough you start being reminded of certain things you’ve seen before.
That’s happening to me more and more often. Mark Twain is credited with having said, "History never repeats itself, but it does often rhyme."
Tech stocks are getting crazy
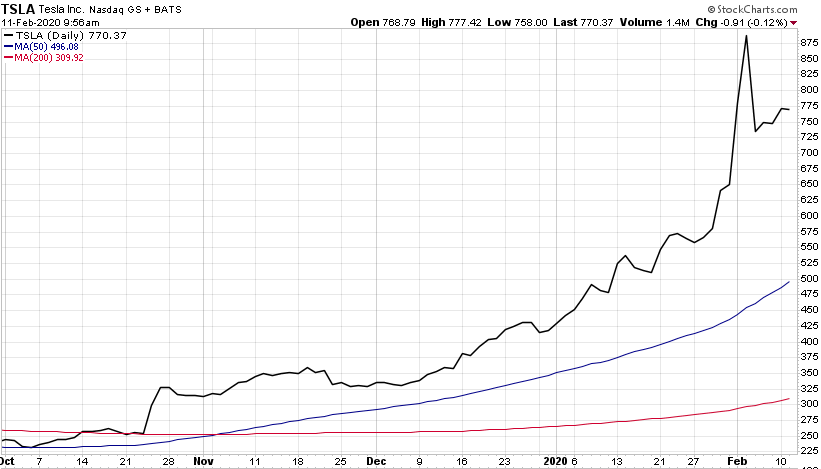
In the past month, two more of these "rhymes" have grabbed my attention. First has been the crazy run Tesla stock has had over the past few months. For those who haven’t been paying attention (which I hope is most of you reading this!), Tesla has gone parabolic over the past few months, more than tripling since late October. At the peak of its craziness early last week, it closed on Monday (Feb. 3) at $780/share. The next day, it shot up nearly $200 to $968, only to lose close to $100 in the last half hour of trading, closing at $887 (the peak of the chart below). It has since drifted down another $100, but at its current level ~$775, it’s still three times higher than where it stood when the Fed cranked up the stimulus in early October.
Click Graph to Enlarge
We don’t normally care about trading in individual stocks such as Tesla. This stands out only because it reminds me of the manic trading in tech "story" stocks that characterized the late stage of the dot-com bubble in the late 1990s. Nothing particularly significant changed in Tesla’s outlook from October to February, but a few analysts and fund managers made crazy statements projecting what Tesla would look like a decade from now and off it went. (Which is in itself, another reminder of the late 1990s: for example, the statement made by Ron Baron that Tesla, with current annual revenue of $24 billion, could reach $1 trillion of annual revenue a decade from now, is, shall we say, optimistic...)
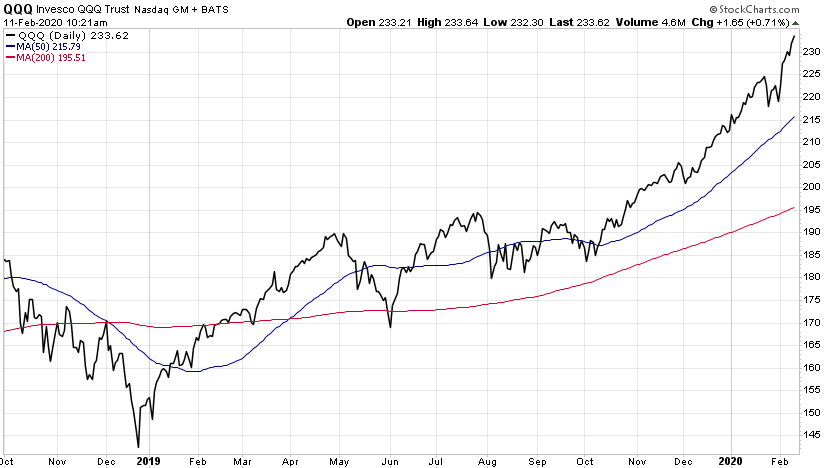
To be fair, this is just one stock, while what really characterized the late 1990’s frenzy was that there were two or three dozen tech stocks acting this way. But before we brush this off too quickly, consider that the Nasdaq index as a whole (represented below by Upgrading holding QQQ) is currently trading at 19.2% above its 200-day moving average. That’s the red line on the chart below — the one tech stocks traded well below throughout the correction of late-2018, and a level that tech stocks also corrected back to (and through) last June before exploding away from that line once the liquidity barrage started four months ago.
Click Graph to Enlarge
To put this a little differently, if tech stocks were to merely correct back to their 200-day moving average — which is not a particularly unusual event — it would likely mean a correction of at least 20% (assuming they dip below the moving average, as is typical for these types of moves). The industry has a term for corrections that exceed 20% — we call them bear markets.
Warren Buffett’s performance and "The Buffett Indicator"
Another similarity of the recent period to the late 1990s: how badly Warren Buffet trailed the market during both periods. He took a lot of heat for it back then, with many questioning if the old man had finally lost his touch. Guess what? The same thing is happening again today.
Buffett was pretty blunt about why he sat out the tech bubble 20-25 years ago. In his folksy way, he basically said he didn’t understand the tech stocks, so he wasn’t going to invest in them. Now we all know that guy is about as sharp as they come, so don’t believe for a second that he couldn’t figure out those companies. When he said he didn’t "understand" them, I think it’s safe to translate that as "I don’t understand how these companies can possibly be worth the prices investors are currently paying for their stocks."
Buffett is rather unique in investing history, and as such, doesn’t perfectly fit into any particular investing "box." But he’s clearly a value investor at heart. One of his favorite indicators, now often referred to as simply "the Buffett Indicator," compares the percentage of total market cap relative to the U.S. GNP (gross national product). Translating that, it’s a simple measure of the total price of the whole stock market compared to the size of the current economy. Buffet has said this is “probably the best single measure of where valuations stand at any given moment.”
As the chart below vividly shows, this measure of market valuations got wildly disconnected from the growth of the underlying economy during the latter half of the 1990s, and Buffett chose to sit most of the period out. He patiently bided his time, accumulating cash, which he put to work when the market finally cracked in 2000-2002.
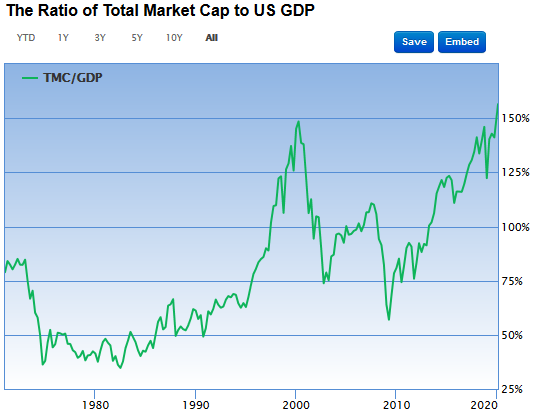
This measure peaked around 150% in March 2000, just before the bear market of 2000-2002 erased 50% of the stock market’s value. It’s tough to make out on the chart, but today’s value is over 156% and still rising.
Not surprisingly, then, we see other recent similarities in Buffett’s behavior and performance. Following his late-90s’ playbook, Buffett has recently been building his cash war chest, which stands at a record $122 billion.
But Buffett has paid for that conservatism in recent investment performance. As Mark Hulbert reports, Buffett’s stock grew just +10.9% in 2019. That’s 20.6% percentage points less than the S&P 500’s gain last year, which is the worst underperformance gap of his 50+ year career. The previous record? You guessed it, a 20.5% gap in 1999, the last time the Buffett Indicator indicated such extremes in market valuations.
Putting these performance lags in perspective, Hulbert points out that over Buffett’s entire career, he’s grown Berkshire’s NAV at a rate of +18.8% annually, nearly double the S&P 500’s annualized rate of +9.7%. Reflecting on where the Buffett Indicator stands today relative to 20 years ago, as well as the striking similarity of Buffett’s performance in 2019 vs. 1999, Hulbert asks, "How willing are you to take the other side of a bet from the most successful investor alive today?"
Sticking with a proven system, even especially when it’s hard
Make no mistake about it, the reason Buffett has been so successful over so long a period is he has defined a system that works for him, and he sticks with it through thick and thin. From time to time he goes through stretches of underperformance. But rather than modifying his approach or questioning whether the market or economy have changed such that his methods are no longer valid, he has the patience to wait for the cycle to turn back and validate his caution. It’s a great example of why SMI considers patience and persistence to be among the most important character traits for investors to develop.
Buffett’s approach obviously struggled last year. Like virtually all active managers, the past decade has been challenging, with his returns trailing the market by -1.5% per year. When you’ve beat the market by +9.1% per year over your 50+ year career, trailing for over a decade causes people to wonder if your best days are behind you.
Can you relate as an SMI investor? If you’re an "old-timer" you remember what Upgrading returns were like prior to the Financial Crisis of 2008, and recognize returns haven’t been as good (at least relative to the market) since. Or perhaps you’re newer but have looked at the backtested results of our DAA strategy and wonder why that strategy has lagged the market since going live in 2013.
One of the very hardest things to do as an investor is to stick with a strategy when you see other approaches working better. But ask yourself, would people think of Warren Buffett as WARREN BUFFETT if he had thrown in the towel and bought tech stocks in the late 1990s like everyone else? Would his long-term performance look the way it does if he went along with the crowd and indexed?
We marvel at Buffett’s long-term returns and rightly so. But we rarely stop to think that to get returns that differ so much from the market’s returns, he’s had to take actions that were different than the market for over five decades. He’s learned how to "be greedy when others are fearful, and fearful when others are greedy."
We don’t want SMI investors to be greedy or fearful, but the idea behind that famous saying is reflected in SMI’s approach. We continue to encourage a healthy allocation to DAA right now, despite its lagging performance during this late-cycle bull run. When the market cycle turns and the next bear market has run its course, we’ll be rowing against the tide in the opposite direction, prodding you to re-engage and get invested more aggressively again (likely well before you feel totally comfortable doing so!). That counter-cycle rhythm is so hard, but it’s also a big contributor to long-term investing success. We don’t try to predict the timing of those changes in advance, but we’re quick to respond once our strategies discern that those trend-changes have occurred.
If you’re having a hard time sticking with your long-term plan, take courage from Buffett’s example. (If you don’t have a long-term plan, it’s time to create one — our free trial offer for new members makes now a great time to get started.) And take heed of the market indicators. It’s possible to hear "stocks are expensive and the economy is wobbly" so many times it starts to lose its effect. These conditions can (and have) persist longer than anyone expects, but eventually market extremes always correct back toward normal. It’s why our current approach is to keep dancing, but with one eye on the door.