

There has been no shortage of angst surrounding market valuations in recent years. Prior to the 2020 COVID crash, SMI warned about valuations reaching historic extremes. Those concerns sounded quaint when less than 18 months later, valuations had, by some measures, not only retraced the entire COVID decline but exploded to levels 33% higher than pre-COVID!
Since then, we’ve witnessed a particularly bruising bear market for bonds and a significant pullback in stock prices as well. So how does the valuation picture look today?
Legendary investor Benjamin Graham famously said, “In the short run, the market is a voting machine, but in the long run it is a weighing machine.” His point was that investors “vote” with their dollars for various stocks based on many factors, including popularity. This greatly influences short-term prices. But ultimately, the stock market rewards investors who appropriately size up the true long-term value of specific companies or markets as a whole and act accordingly.
That sounds great, but it’s easier said than done. Let’s look at some key metrics in an effort to get a sense of the market’s current valuation.
Price/Sales Ratio (P/S)
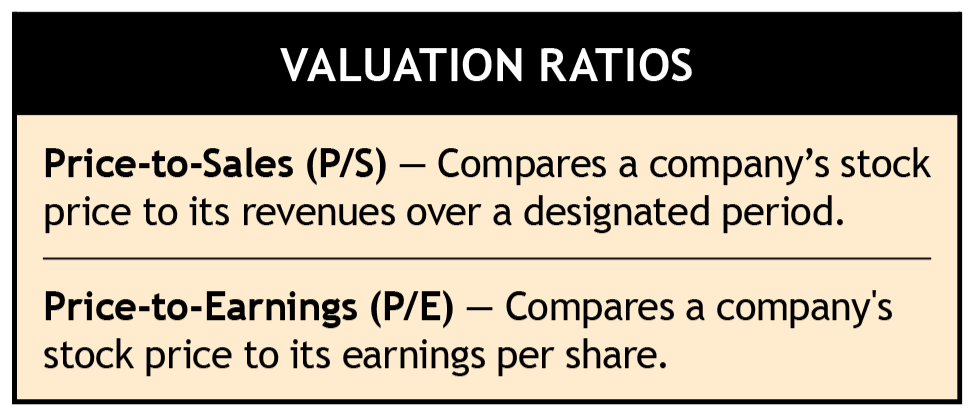
One basic measure of an individual stock’s valuation is reached by dividing a company’s stock price (the total value of outstanding shares) by its sales. This is a simpler measure than comparing a company’s price to its earnings, which we’ll get to in a moment. Sales are relatively straightforward, whereas earnings can be “massaged” using all sorts of accounting trickery.
SMI rarely mentions the price/sales (P/S) ratio because price/earnings comparisons are much more common. But P/S highlights the current extreme valuation of many individual companies, so we’re including it in this discussion.
There’s an infamous story from March 2002, immediately following the bursting of the dot-com stock market bubble, when the CEO of high-flyer Sun Micro Systems took investors to task for having previously bid the company’s stock up to a P/S ratio of 10 (meaning the total value of all the stock outstanding was 10x the amount of the company’s prior year sales). After colorfully walking through all the implausible assumptions implicitly contained in such a nose-bleed valuation, he famously asked investors, “What were you thinking?”
A P/S ratio of 10 seemed extreme in hindsight after watching many tech stocks crash -80% between 2000-2002. Today, a P/S ratio of 10 is barely an outlier. Of the current S&P 500 companies, 37 have a P/S ratio of 10 or more today. The tech-heavy Nasdaq 100 index is even more extreme; 23 of 100 are currently at least that high.
Trailing P/E
Shifting our attention from the valuation of specific stocks to the market as a whole, one of the most widely-used statistics that attempts to determine if stocks are fairly priced (as opposed to being bargains or too expensive) is the price/earnings ratio (P/E). The P/E is calculated by taking the price of an index and dividing it by the reported earnings the stocks in that index generate in one year. (This calculation can also be done at the individual company level to compare the valuations of specific companies.)
Using the S&P 500 index as an example, one would take the price of the index, which was 4,404 in mid-August, and divide that by the earnings per share reported by the S&P 500 companies over the past four quarters. Through June 2023 (end of the most recently completed quarter), those earnings were $181.62, resulting in a P/E for the S&P 500 of 24.2 (4,404/181.62). This formula generates what is referred to as a “trailing” P/E because it uses actual earnings that have already been reported.
Forward P/E
The problem with a trailing P/E is that investors generally care more about what they think stocks will do in the future than what they’ve done in the past. As a result, many prefer to measure valuations based on what earnings are expected to be in the coming year. This “forward” P/E calculation differs in that it uses estimates of what earnings will be over the next four quarters (which are unknown) rather than using past earnings (which are known).
Applying this forward P/E approach to the S&P 500 index, we again take its current price (4,404) but divide that by S&P’s estimate of reported earnings for the next 12 months (Oct 2023-Sep 2024), which are $215.54. This gives us a “forward” P/E of 20.4. (The forward-earnings projection, using data as of mid-August, is from the S&P Dow Jones Indices Earnings and Estimates spreadsheet.)
Unfortunately, history has proven that forward-looking earnings estimates are almost always too optimistic. How likely is it that the S&P 500 companies will earn $215.54 per share over the next year? Considering that earnings peaked in late 2021 and early 2022 at just under $198.00 (when the economy was still riding the re-opening/stimulus sugar-high), it’s a significant leap of faith to believe the next year will produce earnings nearly 9% higher than that prior peak.
Recessions cloud the picture
One of the problems with the ratios we’ve discussed is that relying on short-term data — either past or future — can lead to significant differences in these valuation measures. This becomes particularly acute when the economy is expanding or contracting quickly. Said plainly, recessions tend to make these ratios quite “noisy,” as both sales and earnings can change dramatically during (and surrounding) these recessionary periods.
Given that the threat of recession still looms in the not-so-distant future, we need a way to account for this potential disruption. Thankfully, there are other valuation measures designed to do exactly that. We’ll continue our examination next month with a discussion of those measures and what they currently say about today’s market valuations.