

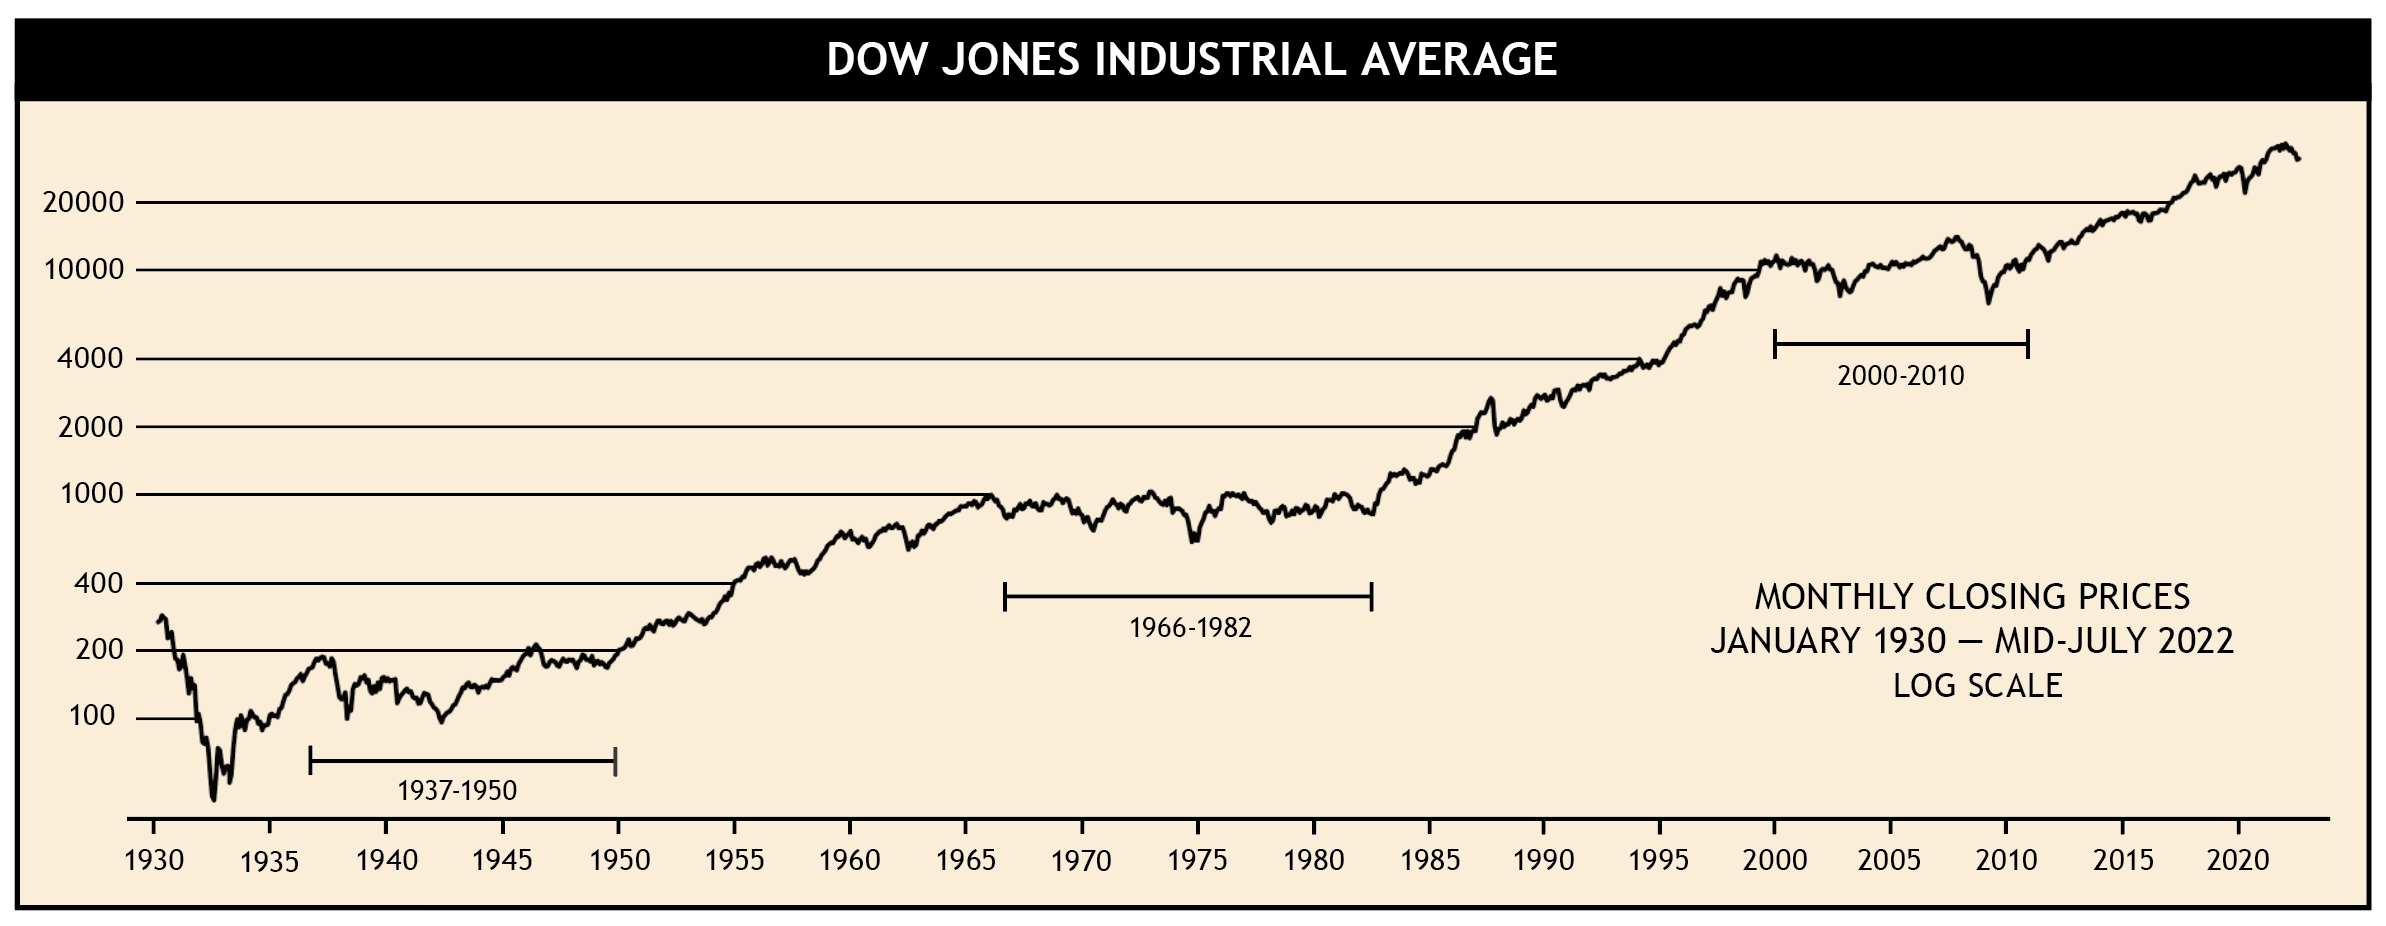
In 1970s Redux?, we recently took a look at the long "plateau" periods the stock market periodically goes through between big, secular bull markets. The key chart from that article was this one:
Click Graph to Enlarge
Peter Garnry, head of Equity and Quantitative Strategies at Saxo Bank posted a similar chart this AM that adds an important detail — it adjusts for the impact of inflation.
We highlighted this chart in our equity note yesterday on today's podcast. The US equity market has had two drawdown in real terms that lasted 13 and 14 years since 1969. Of course a long period of real equity wealth destruction could happen again. Don't be naive. #equities pic.twitter.com/ebUWijfN62
— Peter Garnry (@petergarnry) August 10, 2022
The thing that struck me about Garnry’s version (that hadn’t hit me the same way about SMI’s) was that over the past roughly 50 years, an investor would have spent more than half the time recovering from prior highs in inflation-adjusted terms. 27 of 53 years! This despite it being a period marked by two of the most epic bull markets in history (1982-1999 and 2009-2021).
Different people will take away different lessons from that. The indexing crowd would likely look at that chart and see the incredible overall progress as evidence of the virtues of buying and holding regardless of what the market is doing. And that’s fair, given the long view.
I tend to look at that chart and think, "If I could shave even a little off those huge downturns, imagine the benefit that would have!"
That, of course, is what we’re attempting to do via SMI’s active strategies. It’s reasonable to wonder whether it’s worth it — or if it even works at all — during the long secular bull moves higher. That’s where many people were just a year ago, looking back at the 10-year performance of SMI’s active strategies vs. the market indexes. But if we’re heading into a period where a new orange line is about to be drawn, that’s a totally different story.
Our backtests validate SMI’s approach, pointing to significant improvement in long-term performance by limiting bear market downside. But they’re just backtests until we have a true bear market to prove their mettle in real-time. The other thing the backtests don’t show is how hard it can be to stick with the system when bear market rallies move against our positions. (More on why we think this is still "just" a bear market rally next week.)
Somehow, investors tend to think another big bear market is an imaginary bogeyman, a relic of the "pre active-Fed era" or some such. These charts warn otherwise. We think it’s worth trying to defend against these big drawdowns of our capital, knowing that if we can limit that downside, the math of investing works dramatically in our favor to get our accounts growing to new highs much faster once the new bull market begins.