

[Editor's Note: While the specific data in this article has changed with the addition of Full-Cycle Trend to Stock Upgrading and Real Asset Allocation Model to DAA, the idea behind the framework explained in this article remains intact.]
Over the past 25 years, SMI has developed multiple investing strategies, each with its own strengths, weaknesses, and attractive track record. An investor can use any of these strategies independently, of course, but combining them in specific ways may provide additional benefits.
Here, we explain how to design portfolios built for maximum return while greatly minimizing risk. We also explore how the 50-40-10 combination is affected by our recent revisions to Fund Upgrading (Upgrading 2.0).
Four years ago, we ran an article examining the merits of using a blended “50-40-10” portfolio, where 50% of the portfolio was allocated to SMI’s Dynamic Asset Allocation strategy (DAA), 40% to Fund Upgrading, and 10% to Sector Rotation (SR). Reviewing the past risk and reward attributes of each strategy, that article showed that blending these strategies within a portfolio offered the potential of higher returns with less risk, compared to utilizing the individual strategies separately.
In January 2018, we introduced a “2.0” version of Fund Upgrading. Drawing from the latest research in the study of momentum, this new 2.0 version includes defensive measures designed to shift a portion of Upgrading’s stock holdings to cash as bear-market conditions take hold. That approach shows great promise in reducing bear-market losses, while operating virtually unchanged during bull-market periods. The result is a version of Upgrading that would have produced better overall returns over the past two decades than the original — with considerably less risk.
In light of this significant change to Fund Upgrading, it’s worth re-examining the 50-40-10 research to see what impact this change has on the construction of blended SMI portfolios. Previously, only one SMI strategy could be expected to limit bear-market losses significantly — DAA. Now, having infused Upgrading with defensive potential, questions have arisen about the best way to combine SMI portfolios.
A quick note for new SMI readers: Please understand there’s no need to try to manage multiple strategies immediately. If you’re still in the process of getting comfortable with the basics, feel free to put this issue aside for six months until you’ve mastered using one strategy. Then perhaps come back to this discussion to see how adding additional strategies might enhance your overall portfolio.
How do bonds fit?
Before diving into the various portfolio combinations, we should clarify a few things regarding bonds. From 1982 until just recently, bonds enjoyed a secular (long-term) reduction in interest rates, which pushed bond prices much higher. It’s possible we may yet see a final low in interest rates in the next recession/bear market, but the broad consensus is that we have either already seen, or will see shortly, a turning point from a secular bull market in bonds to a secular bear market in bonds, triggered by higher interest rates.
This concern regarding the safety of bonds was what led to the development of DAA in 2013. SMI’s belief was that in the future bonds might not be sufficient to counterbalance a stock-heavy portfolio as they had in the past. This remains our concern, which is the primary reason SMI has moved in the direction of trying to combat stock risk directly, through DAA and now Upgrading, rather than simply letting the stock side of a portfolio weather bear-market losses. In the past, bonds were enough of a ballast that overall portfolio risk could be managed through the asset-allocation process alone (i.e., selling stocks and adding bonds to reduce risk). We’re not sure that relationship will hold going forward, which is why we’ve reduced our reliance on bonds as the sole means of risk protection in SMI portfolios.
However, that doesn’t mean bonds have become unnecessary. For immediate, short-term risk reduction, bonds are still the best tool for holding losses in check. In other words, if the stock market dropped by 10% next week, we wouldn’t expect Upgrading 2.0 to provide any downside benefit — it’s not designed to react that quickly. DAA likely would provide some minimal benefit, given that it never invests more than two-thirds of its portfolio directly in stocks. But even DAA wouldn’t be a big help until it had time to readjust its portfolio holdings. Only bonds could be expected to hold the line against such immediate losses.
That’s why bonds still have a role to play in the portfolios of those requiring constant risk protection. The difference is that while bonds used to be our sole defense against falling markets, their role has been changed to being the first line of defense, while we wait for help to kick in from DAA and Upgrading.
To be clear, we’re saying that most people still need some bonds in their portfolio. Those using the type of blended portfolios discussed in this article get that bond exposure in two ways. One way is tactical (i.e, non-constant), put in place through DAA when the strategy calls for bonds. But the primary way most SMI readers own bonds is through their Fund Upgrading allocation. We recommend that those utilizing Upgrading take the online risk-temperament quiz and use that result, in conjunction with our Seasons of Life table, to come up with an appropriate stock/bond allocation target. This split determines how to divide the Upgrading portion of your portfolio between Stock Upgrading and Bond Upgrading.
Generally speaking, the more bonds a person owns in his or her portfolio, the lower the overall risk and return potential. Bonds will continue to dampen risk, but it’s virtually impossible for them to contribute the type of returns to a portfolio that they have over the past 30 years. Bond returns are largely math-driven, and it’s simply not possible for them to generate big gains from the low starting yields we have at present.
Because we expect a significant disconnect between past bond returns and what they earn in the future, we’ve made the decision to not include them in this analysis. All of the portfolios discussed below are 100% stock versions of Upgrading. We recognize this makes it harder for those with significant bond allocations to work with these numbers, but the alternative is that readers could be misled by past bond returns that are unlikely to bear any resemblance to what bonds earn in the coming decade.
[UPDATE: As of January 2024, SMI began reporting 50/40/10 returns based on the Upgrading portion being split 60% stocks/40% bonds rather than being all stocks. See Revised SMI Performance Data Emphasizes Blended Portfolios.]
The starting point: Fund Upgrading
Upgrading has been SMI’s foundation for the past two decades. Upgrading’s core idea is that superior performance is available by replacing lagging funds with the current top performers within the same peer group. This reliance on a fund’s recent performance — or “momentum” — is a foundational principle on which most of SMI’s other strategies are built as well.
The primary change from “old Upgrading” to Upgrading “2.0” is a shifting away from relying solely on conventional asset allocation and diversification to handle risk. Both still play a role, but to those we have added market signals that occasionally call for a change in the percentage of the portfolio we hold in stocks.
Here’s how to read all the charts that follow. The vertical axis shows how much better than the market’s return each strategy combination performed. The zero horizontal line at the bottom of each chart represents the stock market’s return, as measured by the Wilshire 5000 index (the broadest U.S. stock market index). If an investment strategy earned exactly the same return as the market, it would appear as a dot right on this zero line. A return lower than the market’s return would be below the zero line. (This never happens in the analysis that follows; if it had, we would need a second set of two boxes on the chart beneath the zero line showing returns lower than the market’s return.)
For our purposes, we want to see strategy results that are as high as possible above the zero line, meaning that results were better than the market’s rate of return.
In addition to measuring returns, these charts also measure volatility (an often-used indicator of risk) relative to the market’s overall volatility level. This is the horizontal axis, with the market’s risk level shown in the center (the dividing line between the gray and white boxes). Here, we prefer to see results as far to the left as possible, indicating that the volatility of a strategy (or combination of strategies) was lower than the market’s. Any points to the right of the zero dividing line indicate a strategy combination that was more volatile (risky) than the market as a whole.
Click Chart to Enlarge
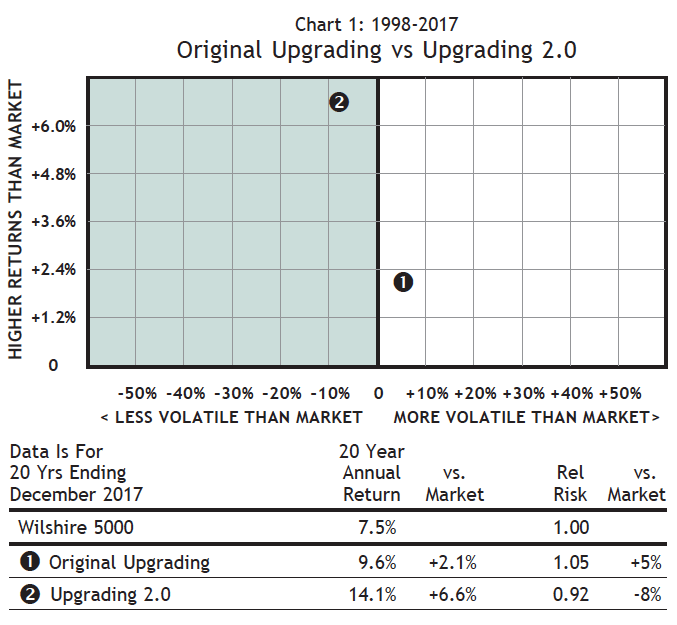
Our analysis begins with a simple presentation of the risk/reward profiles of “old Upgrading” and Upgrading 2.0 (as discussed in the January 2018 cover article). Chart 1 above shows the practical implications of 2.0’s protective protocols.
Point 1 shows the risk/reward performance of a 100% stock “old Upgrading” portfolio over the past 20 years (1998-2017). On average, 100% stock Upgrading earned +2.1% per year more than the market, with 5% more volatility.
Point 2 shows the backtested results of a 100% stock Upgrading 2.0 portfolio. By reducing risk (from 5% more risky than the market to 8% less risky than the market), average annual returns improve from +2.1% better than the market to +6.6% better.
Adding Dynamic Asset Allocation to reduce risk
One of the most significant developments at SMI in recent years was the development of the Dynamic Asset Allocation (DAA) strategy in 2013. DAA takes a totally different approach to asset allocation than SMI’s other strategies. Rather than determining a set allocation to various asset classes at the outset of the investing experience, DAA continually adjusts your allocation between six different asset classes based on the recent momentum of those classes. So while an Upgrading portfolio might be 60% stocks and 40% bonds for many years in a row, a DAA portfolio might be 67% stocks and 33% bonds one month and have nothing allocated to either class a month later! (If you’re not already familiar with how this strategy operates, we strongly encourage reading Dynamic Asset Allocation: An Investing Strategy For the Risk-Averse.)
DAA “wins by not losing” — meaning that what DAA isn’t invested in is just as important as what it is invested in. The timing mechanism built into DAA would have allowed the strategy to sidestep some of the stock market’s worst losses in recent decades. By riding established trends in various asset classes, DAA has been able to capture a healthy portion of the upside when classes perform well, while avoiding much of the downside when they fall.
DAA won’t perform as well as Upgrading when stocks rise, because it is never fully invested in stocks. But it can hold up much better than Upgrading — even the new Upgrading 2.0 — when stocks fall, because it is designed to exit its stock holdings more quickly. DAA has a “faster trigger” so to speak, whereas Upgrading’s protective protocols are intentionally designed to kick in only when the market has already deteriorated significantly. As such, DAA is still SMI’s premier defensive strategy, while Upgrading remains oriented more toward offense than defense. Because of these varying strengths and weaknesses, DAA and Upgrading are still complementary strategies.
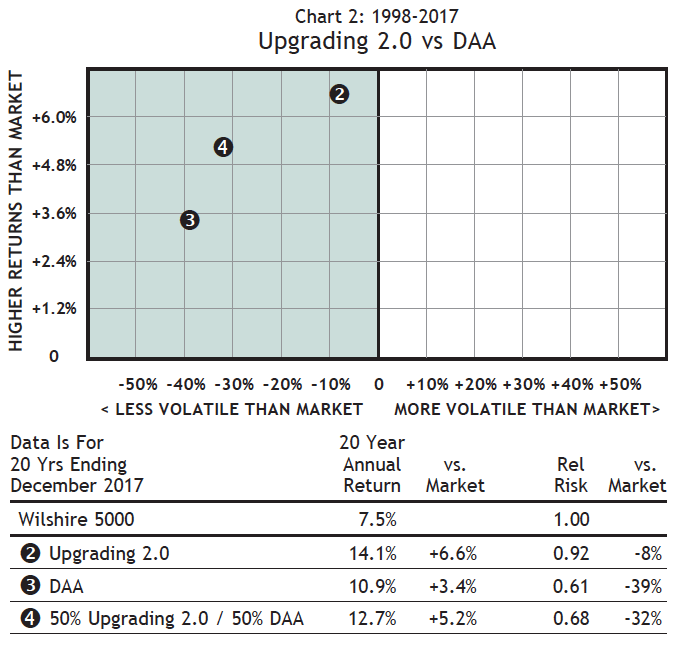
Chart 2 shows how DAA and Upgrading 2.0 compare, as well as what happens to the risk and return of a portfolio when it is divided 50-50 between Upgrading and DAA. A pure DAA portfolio (point 3) had lower returns than a pure Upgrading 2.0 portfolio (point 2), but also considerably lower volatility — DAA was -39% less volatile than the market whereas Upgrading 2.0 was -8% less volatile. There’s a significant trade-off here between risk and return.
Click Chart to Enlarge
Interestingly, a 50-50 blend of DAA and Upgrading (point 4) performed slightly better than a simple average of the two strategies, while also providing most (though not all) of the volatility advantage of DAA. We’re onto something here!
Adding Sector Rotation to turbo-charge returns
Sector Rotation (SR) is SMI’s highest-risk, highest-return strategy. Its track record has been extremely impressive since we rolled it out in 2003 (as well as in our backtesting, which extends back to 1990).
SR is a concentrated form of Upgrading, performed on narrowly-focused sector funds that invest in specific slices of the economy. Whereas Upgrading focuses on broadly diversified mutual funds, Sector Rotation focuses on higher risk, non-diversified ones. Also, whereas Upgrading involves owning multiple funds, SR owns only one fund at a time. This narrow concentration increases risk, as there are no other holdings to buffer overall performance if the one sector we’re invested in does poorly.
Those bold enough to allocate to SR have been richly rewarded. Over the past five years, SR has returned more than +30% annualized, and over the past 15 years (which is only slightly longer than SR has been a live SMI strategy), it has averaged over +20% per year. Those are stunning returns. But they come with significant short-term volatility. SR has experienced three-month losses as high as -37.9%, and as recently as 2015 lost a gut-churning -21.8% in just 10 days. Most people are ill-prepared to deal with that type of volatility, which is why SMI has suggested it’s appropriate for most members to limit SR to 5%–15% of their total portfolio .
Wouldn’t it be great if we could get the awesome returns of SR without the associated increase in volatility? Perhaps you can see where we’re headed — there is! We just saw how dramatically DAA lowered volatility when added to an Upgrading portfolio. Now we’re going to give back a little of that volatility improvement in order to boost returns via SR.
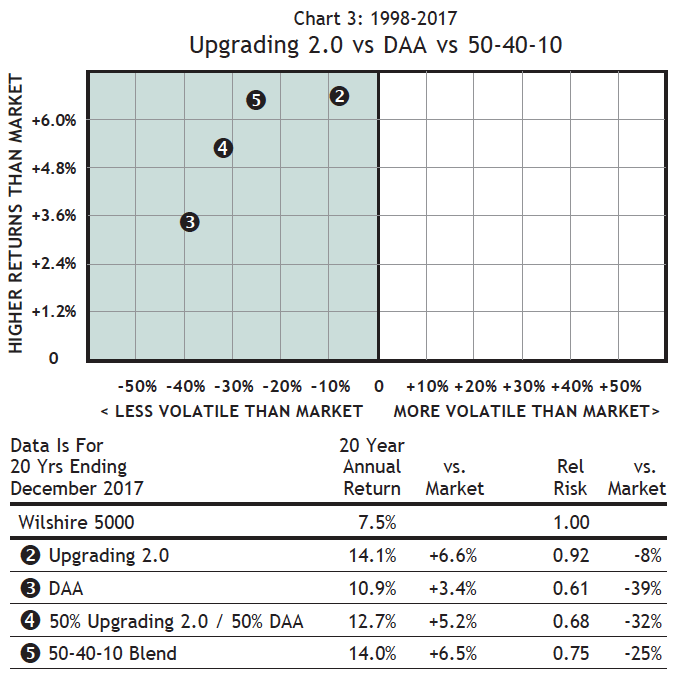
Chart 3 shows what happens when we take 10% of the total portfolio away from Upgrading and devote it to SR. This is the 50/40/10 portfolio we settled on four years ago, only it uses the new “2.0” version of Upgrading (as all the charts and tables after the first one do).
Adding SR (Point 5) pushes our volatility higher, but only slightly when compared to the 50-50 blend (Point 4). In essence, by adding DAA and SR, we’ve been able to get our annual returns back up to the Upgrading level (+6.5% above market vs. +6.6%), but we’ve improved our risk profile considerably, dropping volatility from 8% below market to 25% below market. Significantly higher returns than the market with 25% lower volatility is definitely a winning combination!
Click Chart to Enlarge
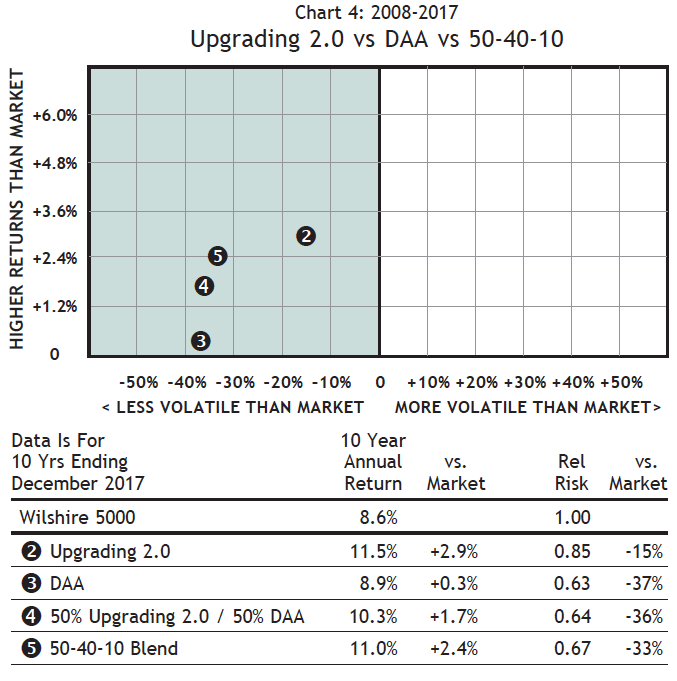
In fairness, the 2008-2017 decade hasn’t been as exceptional for Upgrading or DAA, relative to the market, as the 1998-2007 decade was. So we wanted to see if the relationships seen over this longer 20-year period also held during the more challenging, Fed-policy dominated past decade. Those results are depicted in Chart 4 below.
Click Chart to Enlarge
We used the same dot numbers for each portfolio so we can easily compare Charts 3 and 4. The only difference between those two tables is the 20-year vs. 10-year period being measured. As you can see, the relationships between the four portfolios stayed more or less the same (the arc created in each chart is similar and the portfolios land in the same basic order). The biggest difference is the margin of outperformance relative to the market was less over the past 10 years. There was also a decline in volatility, which makes sense given that overall market volatility has been well below average during this Quantitative Easing era.
While the superiority of SMI’s returns has been lower over the past decade, it’s worth pausing to reinforce just how significant a 2%-3% advantage over the market is. A starting investment of $100,000 in 2008 would have grown to $228,191 by the end of 2017 at the +8.6% rate earned by the broad market. That same investment would have grown to $283,942 if it earned the +11.0% annualized return of 50-40-10 (Portfolio 5) — while also experiencing 33% less volatility. That extra +2.4% per year compounds to a significant difference in total return!
Other portfolio combinations
After analyzing all of the new data, we’ve concluded that a 50-40-10 portfolio is still as good a starting point as any for the “average” SMI reader. But admittedly, with the new Upgrading 2.0 changes, there are now many more acceptable combinations, depending on the specific situation and preferences of each particular reader. So while SMI will continue to refer to 50-40-10 (with 50% DAA, 40% Upgrading, and 10% SR) as the “baseline” for blended portfolios, here’s a look at some other portfolio combinations that may be of interest to SMI readers. We obviously can’t detail every possible combination, but the following will illustrate the tradeoffs being made as the risk/return dial is turned either higher or lower.
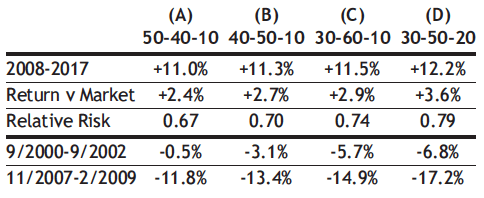
The table at right shows the impact of shifting money away from DAA and into Upgrading. Read each column header the following way: the first number is the DAA percentage, the second number is 100% stock Upgrading (although readers should substitute their specific stock/bond split when implementing), and the third number is SR.
The main takeaways from this table are that as a portfolio de-emphasizes DAA and adds to Upgrading (columns B and C), overall returns increase, but so does volatility and the extent of historical bear-market losses. While not shown, this same pattern would be expected in the other direction as well — taking away from Upgrading to boost DAA beyond 50% would likely produce lower overall returns than 50-40-10 while continuing to drive down risk and bear-market vulnerability.
In addition, caution is in order regarding the final portfolio shown (column D). Given the great returns it has produced, many will be tempted to add to their SR allocation. That may be appropriate for investors with longer time horizons and high risk tolerances. But the emotional toll of SR’s occasional extreme losses can be high, so we continue to caution readers not to take on more risk than they can stick with long-term. We recommend reviewing Sector Rotation in Light of Upgrading 2.0 for additional analysis regarding using SR within a blended portfolio.
Three ways to implement these changes
As we noted at the outset, this article deals with advanced material. Managing multiple strategies requires more from an investor to maintain his or her portfolio. DAA and SR are updated on the last weekday of each month, which means additional responsibilities in between monthly issues of SMI.
If that’s more involvement than you want, there’s no pressure to add DAA and/or SR to a basic Upgrading portfolio. But these charts do clearly demonstrate the potential impact of tuning in one extra day each month and making a handful of extra trades each year. Is that worth the significant reduction in risk between a pure Upgrading portfolio and a 50-40-10 portfolio as Chart 3 illustrates? For most readers, we believe the answer should be yes.
Thankfully, if you aren’t up for the challenge of managing multiple strategies yourself, SMI Advisory Services offers two good options to handle the task for you. For those happy with a standard 50-40-10 allocation, there’s a mutual fund that can easily handle that for you. By mid-late April, this fund should be available for purchase via most broker platforms. Stay tuned for further details.
For those who want to fine tune (or have SMI Advisory fine-tune for them) the exact mix of strategies within their portfolio, last month’s announcement of the new Private Client program should be of interest. To recap that option, Private Client provides professional management of a custom, personalized blend of SMI investing strategies, with each strategy managed for you by SMI Advisory Services. Your portfolio holds the specific underlying holdings for each strategy (rather than owning the SMI mutual funds), so it is similar to what you would own if you were managing all of the strategies yourself. But Private Client provides professional guidance as to how to allocate appropriately between strategies based on your specific needs. Further, all of the work of managing the portfolio on an ongoing basis is done for you, including rebalancing, etc. See the March 2018 article about SMI Private Client for more details, or sign up at smiprivateclient.com.
Additional thoughts
As we have often been reminded, “past performance is no guarantee of future results.” Most of the performance data shown in this article reflects the 20-year period from 1998-2017, with Chart 4 and the last table zooming in on the most recent decade (2008-2017). Future periods will yield different results. This is the main reason we’ve focused on the returns of these strategies relative to the overall market rather than on their absolute returns, which vary throughout the market’s long-term bull/bear cycle.
We’ve intentionally used periods that include complete market cycles, including the bear markets of 2000-2002 and 2007-2009. Investing strategies can be measured accurately only over complete market cycles, as their performance advantage tends to be concentrated in either bull or bear markets. For example, looking at the past five years for DAA doesn’t give us an accurate picture of what to expect from the strategy going forward, because those are all bull market years and DAA’s primary virtue is defensive bear-market performance. A helpful guiding principle is to understand that the longer you apply these strategies, the greater likelihood you’ll get long-term returns similar to what they’ve produced over long periods in the past.
Some may look at these data and consider making some of the changes but not others. Our counsel is this: it’s fine to add DAA to an Upgrading portfolio and omit SR. This takes you to the portfolios shown in Chart 2. But be careful about adding SR if you aren’t also adding DAA. DAA is what squelches the overall volatility of the portfolio — without it, you’re adding a riskier SR strategy onto Upgrading (which Chart 1 shows is only slightly less volatile than the overall market) without doing anything to dampen that risk. That’s not necessarily “wrong” to do, but you need to be clear on the implications and be prepared to stomach greater volatility.
Finally — don’t worry about being overly precise with your percentages and amounts. As the table of various portfolio combinations above shows, shifting 10% from DAA to Upgrading doesn’t make a huge difference, so the impact of a few percentage points one way or the other isn’t likely to be significant. So, if you have multiple accounts and the amount of one of them happens to fit rather closely with one of the percentages you desire, go ahead and use it. The ease you’ll gain by satisfying the needs of one of the strategies in that account will be worth any small deviation in results you might experience.