

It’s not always clear to members how the SMI strategies accomplish the basic investing objective of buying low and selling high. While there are occasions when we will sell an investment and leave the proceeds in cash (typically during bear markets when our temporary “defensive protocols” kick in), those are relatively rare. It’s much more common for SMI’s strategies to sell one investment and use those proceeds to immediately buy a new one. But whether selling for cash or a new holding, the process of buying “low” and selling at a higher point is a central theme.
At the core of all the SMI active strategies are the principles of trend-following and momentum. Simply stated, trend-following means we are looking to invest in things that are already going up, and avoid investing in things that are going down. Momentum is the mathematical way we measure what is going up or down and how quickly, giving us an objective standard to choose one investment vs. another.
A stark contrast to the investing mainstream
That we would specifically seek out investments that are already increasing in value might seem obvious. It’s actually not. In fact, the vast majority of today’s investors follow one of two approaches:
Indexing, which makes no attempt to determine either which investments will outperform or when is a good/bad time to invest. Indexers make no distinction between assets that are currently rising vs. falling.
Active investing based on trying to predict what will happen in the future. Investors base these predictions on various forecasts, expert opinions, and so forth. Making investment predictions is the lifeblood of the professional investing class, which drives the 24/7 investing media machine. This approach sometimes involves choosing investments that have been poor recent performers, expecting them to be better performers in the future.
Both indexing and predictive investing are different than SMI’s active investing process. SMI monitors what has already happened and uses that to direct what we invest in right now. There’s a large body of academic research — plus 35 years of SMI’s experience — that backs up the validity of this quietly effective investing approach.
Buy low, sell high
The “sine wave” chart below provides a simple visual of what trend-following using momentum attempts to do. This same visual can be applied to many various types of cycles, but let’s consider it in terms of the long-term path of the overall stock market.
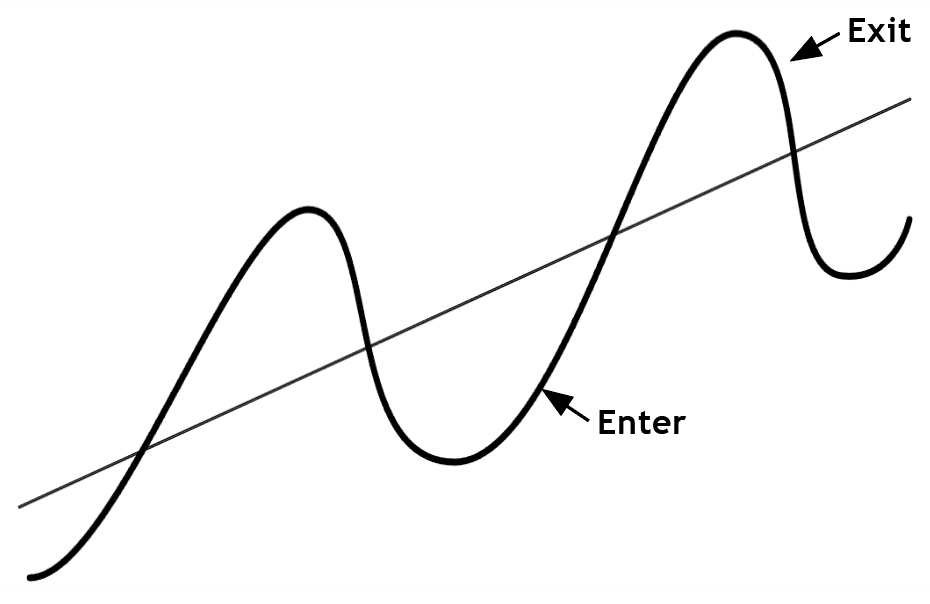
The diagonal line cutting through the center of the chart from bottom-left to top-right shows the market’s long-term tendency to rise over time. This is the line that indexers say is the important one. They argue (largely correctly) that given a long enough time horizon, investors should just keep plowing money into stocks because eventually the market’s trajectory is higher.
That’s been mostly true in the experience of the U.S. stock market but conveniently ignores some rather large examples elsewhere in the world where that didn’t work out so well. An investor in Japanese stocks, for example, waited nearly 35 years after its December 1989 high for that market to return to that lofty level.
Setting that aside though, SMI largely agrees with the idea of investing for that long-term line. We just think investors can improve upon it by taking advantage of the never-ending cyclicality within markets. In other words, we think opportunities to improve returns exist by making adjustments based on the cycles that ebb and flow around the long-term market line.
This is where the trend-following idea comes in. In terms of the larger bull/bear market cycles, this is likely most easily understood by focusing on SMI’s Dynamic Asset Allocation strategy (DAA). DAA’s goal is to identify when the big market trends change. As the sine wave diagram shows, DAA hopes to identify when bear markets end and new bull markets begin (the “Enter” label) as well as the opposite, when bull markets end and bear markets begin (the “Exit” label).
Importantly, we’re not trying to predict these market turns in advance, as so many try to do. Rather, we’re simply observing what the market is already doing and responding to it based on the market’s own momentum.
Notice that the enter and exit labels aren’t precisely at the top or bottom of the cycle. That would be ideal, of course. But we recognize that if we’re waiting for the market to tell us its direction has changed, this is by definition going to happen after the trend change occurs. Thankfully, our testing of various models, as well as our live experience navigating the big bear markets (like 2000-02 and 2007-09) have shown us that we don’t have to catch the market’s exact tops and bottoms for this to be a highly effective approach still.
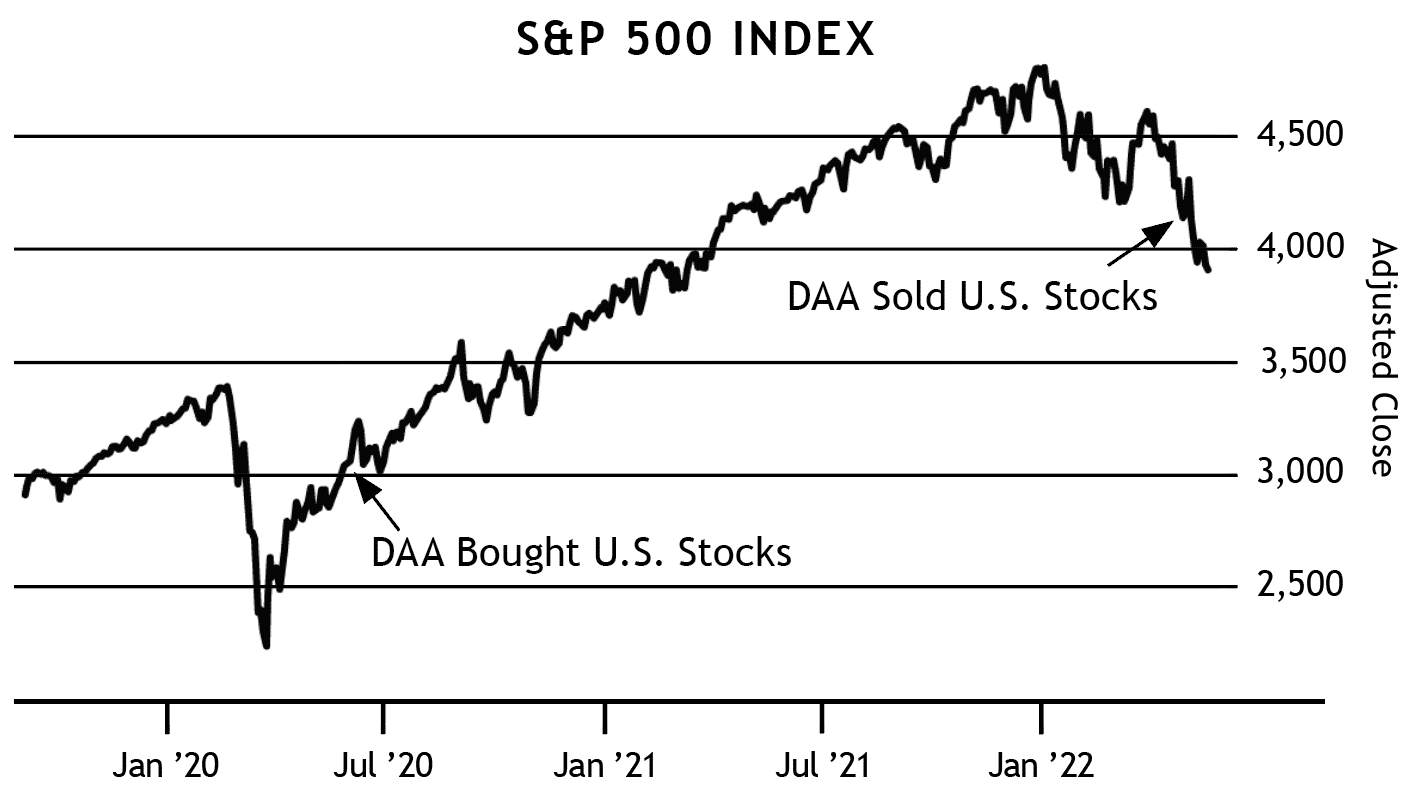
The second chart below illustrates how this concept works in practice. It shows the S&P 500 index from 2020 through early 2022. This period is a great example of the general “sine wave” pattern pictured above. SMI’s Dynamic Asset Allocation interacted with U.S. Stocks in a very similar manner to that ideal, entering them shortly after the COVID market bottom in 2020, then exiting shortly after that bull market peaked in January 2022.
Effective for smaller cycles too
Of course, turning points between major bull and bear markets are rare. Thankfully, the same principle illustrated in the sine wave chart works for both the market’s smaller cycles, as well as bull/bear cycles in other asset classes. For example, last month’s cover article on gold showed how DAA started producing buy signals shortly after gold’s two-decade-long bear market ended in 2000, kept DAA invested in gold through most of its 11-year bull market, then exited shortly after its peak in 2011. DAA was then largely out of gold for the next several years until the following bear market ended and DAA started buying again in 2019.
Less clear, perhaps, is how this same principle drives our investing decisions in other SMI strategies. For example, within Fund Upgrading, this same process helps us determine whether to be invested primarily in growth stocks vs. value stocks, then guides us to the strongest performers within those respective groups. Within Sector Rotation, it helps us identify when the momentum of a particular “sector” of the economy is slowing and it’s time to shift to another which is on the ascent.
Of course, there’s more to it than that — figuring out how to turn the market’s real-time performance data into meaningful momentum signals to drive these trend-following strategies has been SMI’s focus for 35 years now. But the principle is as simple as that sine wave chart. Markets are constantly ebbing and flowing, cycling between extremes at varying time intervals. Harnessing that information and learning how to use it in order to navigate both the bigger cycles (between bull markets and bears) and the smaller ones is the key driver of SMI’s investing process.