

Cycles are part of the fabric of creation. The sun rises, sets, and rises again. Tides come and go. The four seasons arrive and depart, only to return next year.
Like nature, financial markets also go through cycles, although they are less predictable than those in the natural world. The most familiar cycles to investors are “bull” markets, when prices and market indexes rise, and “bear” markets, when they fall. These cyclical market trends usually track economic growth and optimism, or the lack thereof.
Fortunately for stock investors, bull markets tend to last much longer than bear markets, and bulls typically add significantly more value than bears take away.
Although the boundary lines between bull and bear markets are not universally agreed upon, a common definition of a bear market in stocks is a drop of at least 20% from the most recent peak as measured by the S&P 500.
Shorter cycles within longer cycles
In addition to the bull and bear “cyclical” trends described above, much longer market cycles also occur. These are called “secular” cycles, from the Latin saeculum, meaning “a generation” or “an era of time.”
The graph below shows the cyclical and secular trends in the U.S. stock market since 1950.
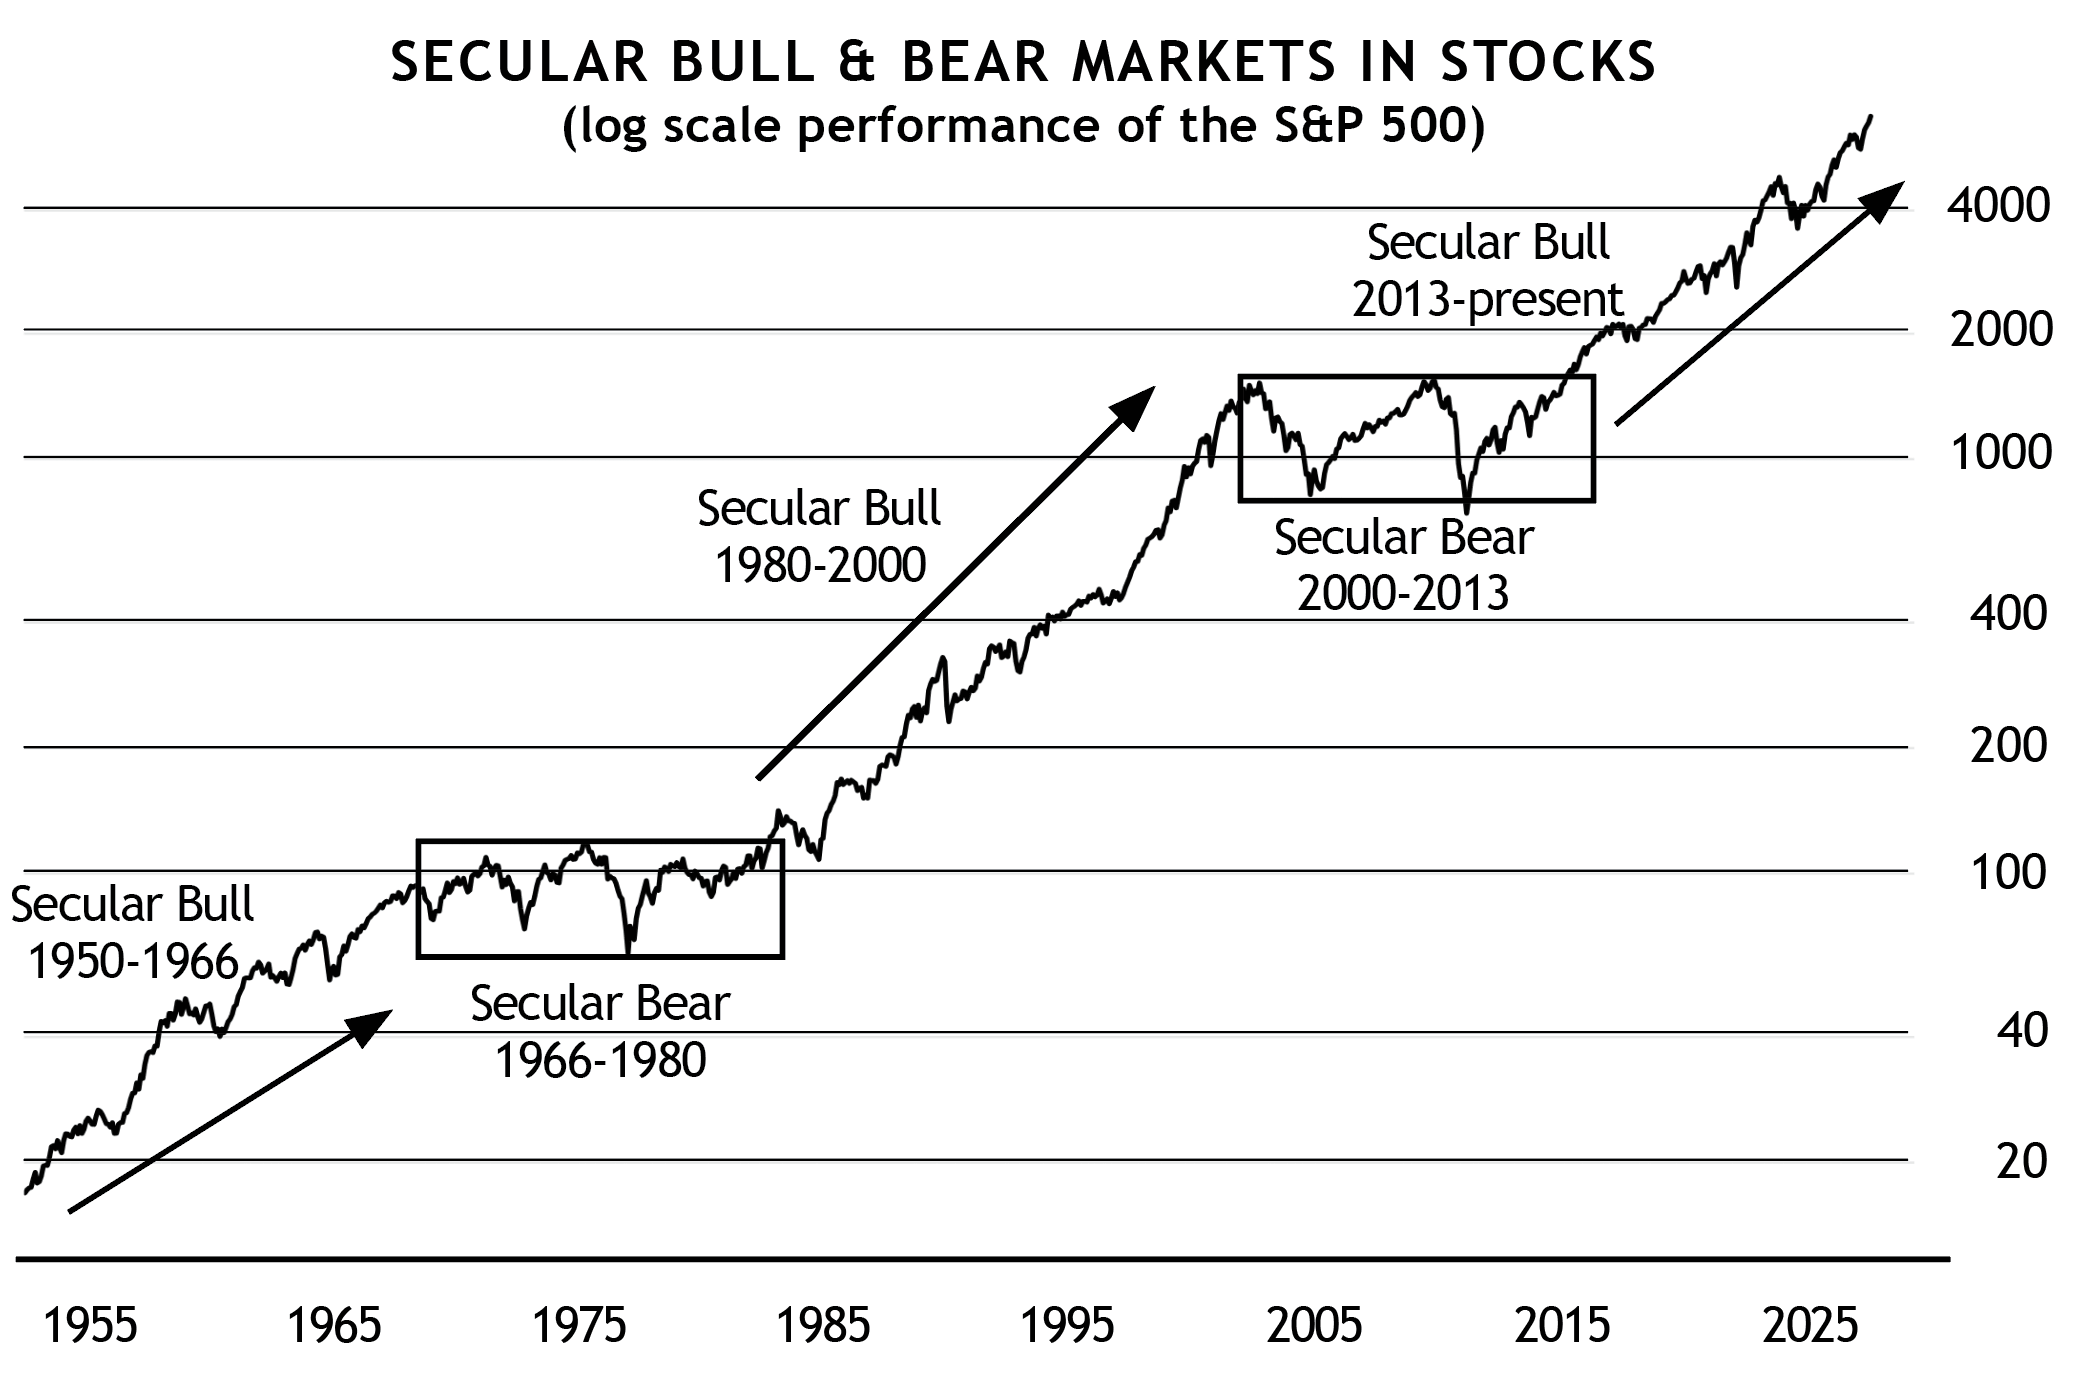
click to enlarge
As illustrated, there were two long-term secular bear markets (see rectangular boxes), during which stocks stayed within a range despite — at times — notable market gains.
With stocks, more attention is given to cyclical (i.e., short-term) bulls and bears because their magnitude can be so significant. Declines of 20%-50% can occur within relatively short periods. That’s a big deal to most investors!
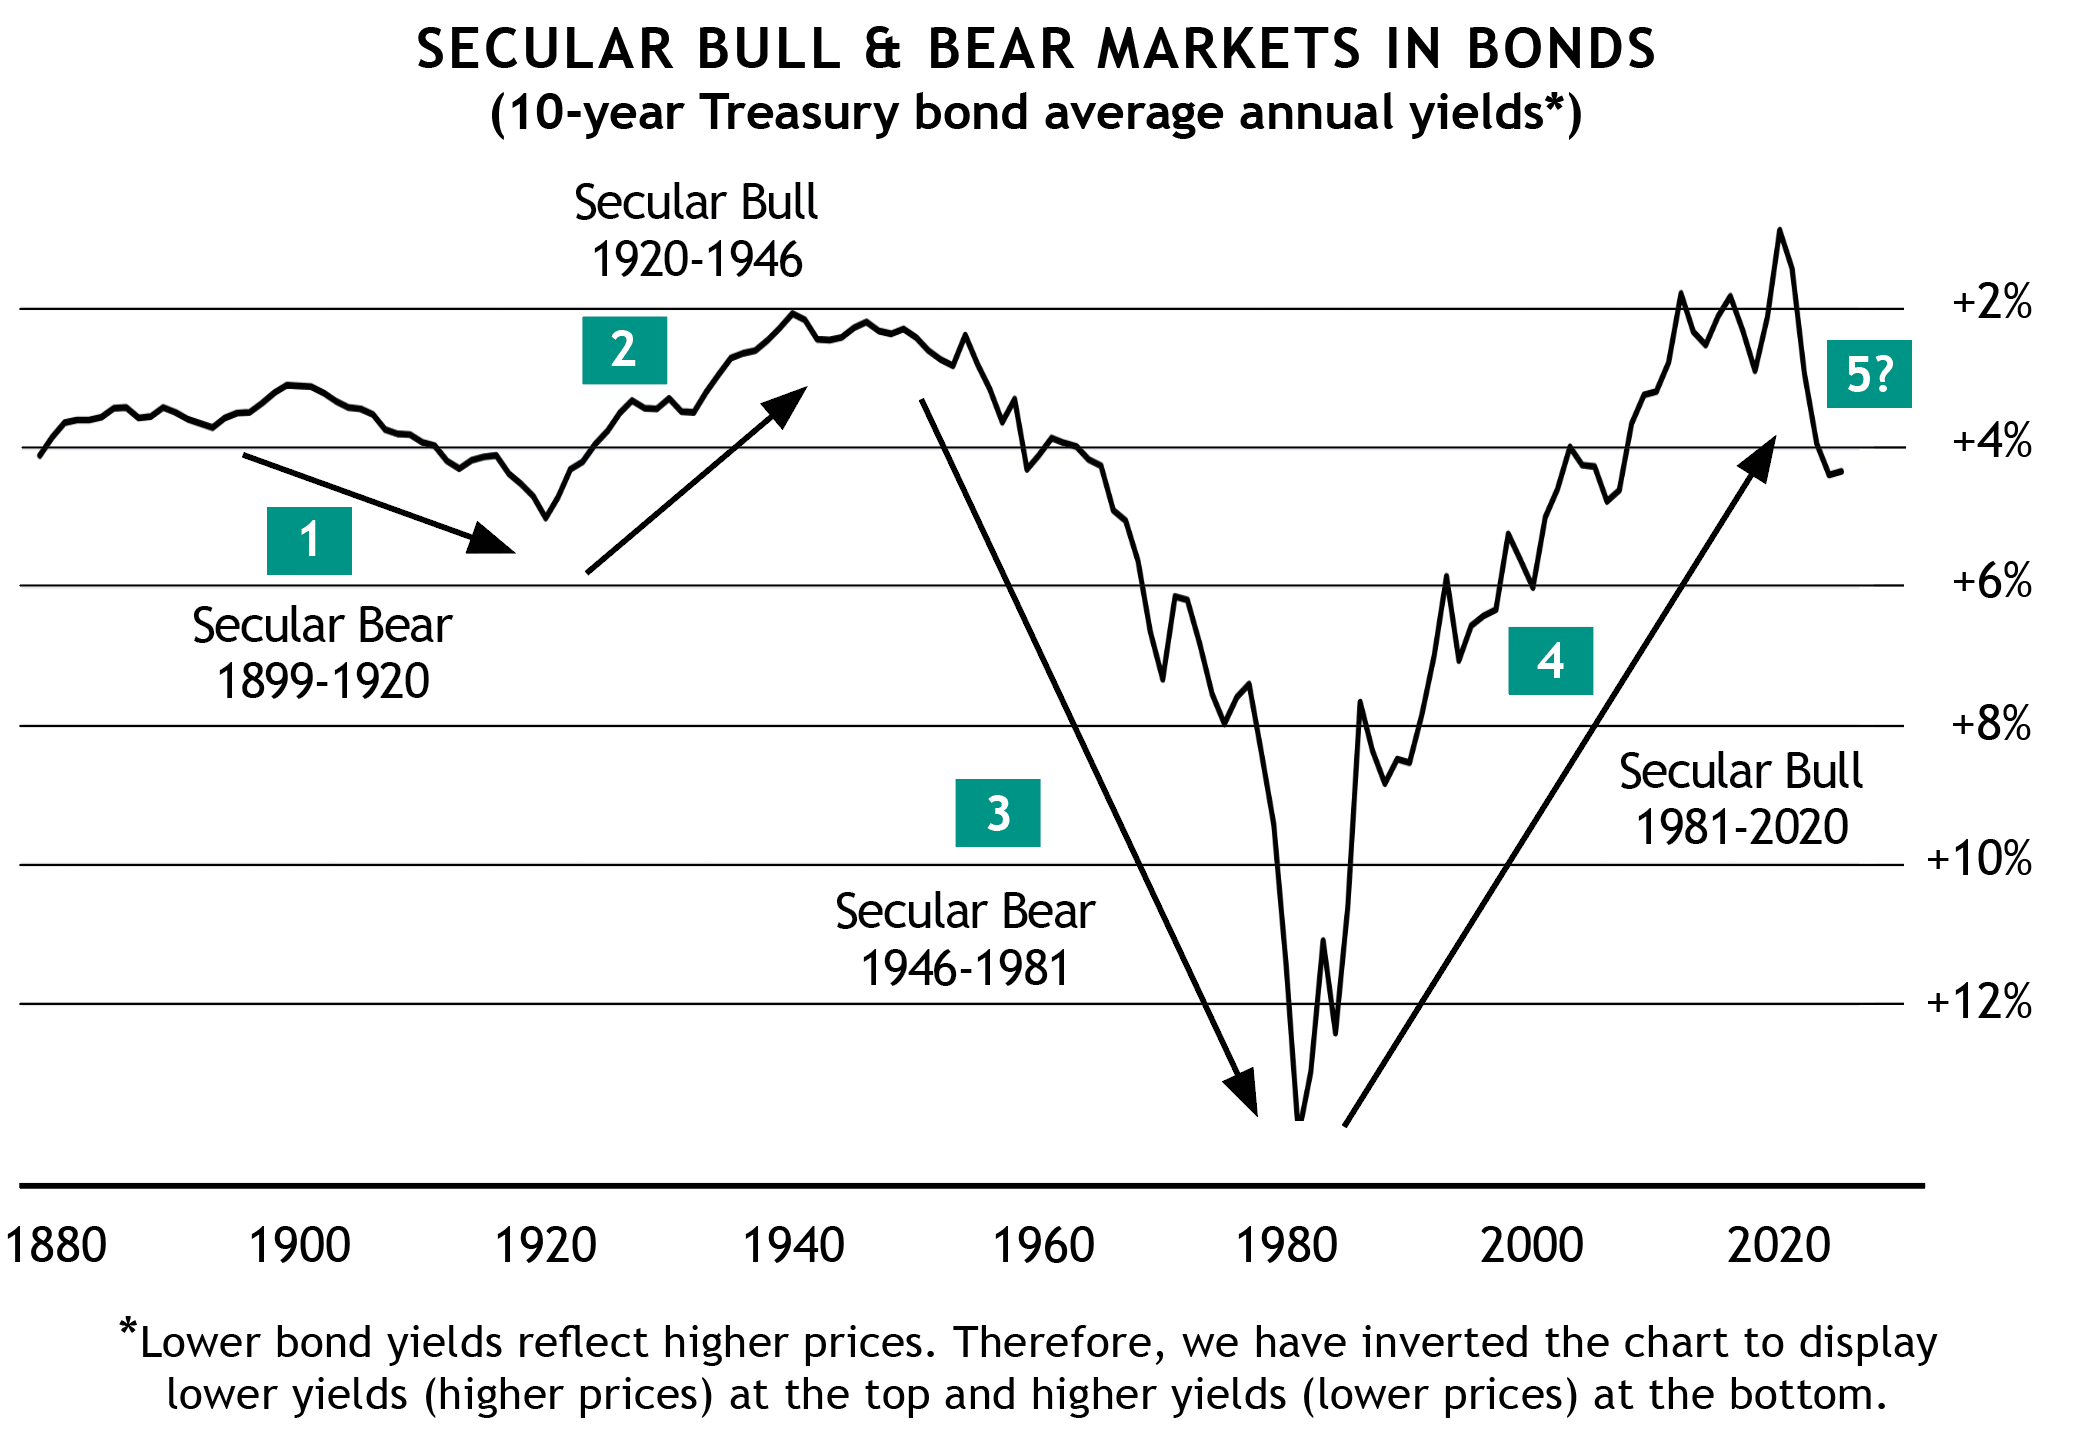
On the bond side, cyclical trends are generally moderate, while secular trends are more lasting and pronounced. Secular bond trends typically continue for decades, as shown in the second chart below. You’ll notice just four major movements in rates (see numbering in green boxes) over the past 120-plus years! Today, we may be in the early stages of a fifth such move.
While a secular bull market in bonds is a boon for investors, a secular bear can be challenging to navigate.
click to enlarge
Bond investing 101
We’ll explain more about the bond chart shortly. But first, here’s a quick review of the bond basics. Unlike stocks, which represent an ownership share in a company, bonds are essentially IOUs. With bonds, you’re not an owner but a lender. You lend your money to a business or government, and the bond represents a promise from the bond issuer to repay you, with interest, on a set schedule.
A specific bond’s interest rate stays the same throughout its entire term. This is important to understand because overall interest rates can go up or down during that time. If future rates decrease, your bond becomes more attractive in the marketplace because the bond will continue to pay its fixed higher rate. Therefore, other investors will likely be willing to pay a premium for it.
However, if prevailing rates increase, your bond becomes less appealing. If you needed to sell it, you would have to do so at a discount. After all, who wants to buy a bond paying 3% when a similar quality bond selling for the same price is now being issued at 5%? Therefore, as rates increase, the prices of existing bonds decrease, and bondholders holding lower-rate bonds may have to sell at a loss. (An investor who doesn’t sell but holds a bond until its maturity date will continue to receive the originally agreed-upon interest rate until the bond matures.)
A bond mutual fund, which holds multiple bonds, isn’t immune to this “interest-rate risk.” Any drop in the value of its bond holdings is offset against the fund’s interest income. If the loss in value exceeds the interest received, the bond fund’s share price declines. (This is why bond funds with longer maturities carry more rate risk than those with shorter maturities. See Duration: A Simple Way to Gauge Bond Risk.)
Secular bulls and bears in bonds
As the bond chart above illustrates, U.S. bond investors endured a roughly 20-year bear market at the beginning of the 20th century and a 35-year secular bear that started right after World War II and stretched into the early 1980s. (Note that the chart is inverted, with lower interest rates at the top and higher rates at the bottom. This better illustrates that bond prices rise when rates decline.)
In the 1970s, a period of strong inflation and increasing rates saw bond yields hit more than 15%(!) before they finally changed direction in 1981. As rates started to decline, the demand for existing higher-yield bonds grew, causing prices of those bonds to increase. A roughly 40-year bond bull market transpired, lasting into 2020.
Today, after years of extremely low interest rates, the bond market is in a different situation. Rates hit a low of 0.5% on the 10-Year Treasury in 2020 and have risen significantly since. Although we can’t predict the future, and yields can certainly decline in the short term (as they have recently), it’s wise to consider that bonds may have entered the early stages of a new secular bear market.
SMI is wary about the risk of a long-term bear market in bonds. That’s why we created the Dynamic Asset Allocation strategy, which offers a variety of investment options — not just bonds — for the part of a portfolio not invested in stocks.
We certainly haven’t abandoned bonds, but bond investing is no longer the “slam dunk” it was during the last 40-year bond bull. With higher inflation eroding the value of savings and rising rates potentially weakening bond prices over the long term, the appeal of fixed-income investments isn’t what it used to be.
Fortunately, SMI portfolios are already designed for this possibility. Consider a 50/40/10 portfolio (50% allocated to Dynamic Asset Allocation, 40% to Upgrading, and 10% to Sector Rotation). Assuming the Upgrading portion is split 60/40, as is common, that means 16% of the overall portfolio is allocated to Bond Upgrading. However, bonds are also part of the DAA portion of 50/40/10 via the RAA ETF. RAA has a “default” bond allocation of 30%, thus adding another 15% of bonds to a 50/40/10 investor’s overall portfolio.
Altogether, Upgrading’s bonds and DAA’s bonds currently account for roughly 30% of a typical 50/40/10 portfolio. This is much lower than the bond allocations found in many modern portfolios, which typically range from 40% to 60%.
Smaller picture, bigger picture
Although SMI’s momentum-based strategies focus on shorter-term cyclical trends — particularly recent performance — it’s important to consider the bigger picture of longer-term secular trends too, especially with bonds.
Being ready to react to short-term performance changes while also monitoring potential long-term shifts is like checking the weekend weather forecast while keeping in mind that seasonal changes will happen eventually.