

A few follow-up thoughts to Matt’s excellent post yesterday...
The pundits have been out in full force trying to explain why the market has stumbled over the past week, as well as trying to convince us of what it will do next. As usual, there are some good potential explanations out there, and some not so good ones.
I like Cullen Roche’s explanation for the recent decline the best:
Everyone wants a fancy sounding story for why the stock market goes down, but in most cases it’s as simple as “because it went up a lot."
My advice? Ignore all the explanations, because the reasons behind a 5%-7% decline probably aren’t particularly important. Especially when this degree of mild (by historical standards) decline follows the type of huge run-up the stock market has seen the past 14 months.
Let’s review:
The stock market recently set an all-time record for the longest advance without a pullback of at least 3%.
The stock market recently set an all-time record for the longest advance without a pullback of at least 5%.
The stock market is currently in the 9th-longest stretch ever without a 10% correction. (And on top of that, the period immediately prior to the last 10% corrections in 2015-2016 was the 3rd-longest stretch ever without a 10% correction. So we’ve had the 3rd-longest and currently 9th-longest such streaks back-to-back, with two quick 12% corrections that lasted a total of six months separating them.)
Here’s a visual picture of that:
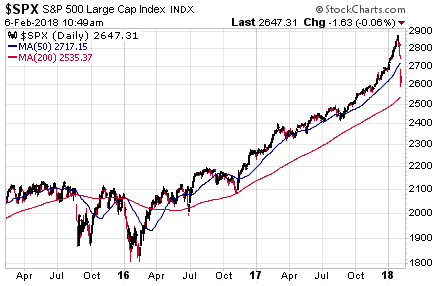
The last two 10% corrections are obvious in late-2015 and early-2016. Notice how the market continued to periodically bounce back down to touch the red line (the market’s 200-day moving average) through the election in November 2016. As 2017 began to unfold, the market kept moving higher. Only now, instead of periodically coming back down to touch its 200-day moving average (the red line), it was periodically touching down to its 50-day moving average. Then starting around September, it left even that shorter-term moving average and just started rocketing higher. Not to make too much out of this, but it’s obvious just how far above these moving averages the market had gotten before the pullback of the past week.
Hopefully, you realize that this is extremely unusual behavior. The market doesn’t typically go straight up for extended periods of time without correcting. We’ve had 10%+ corrections just four times in the last nine years (2010, 2011, 2015, and 2016) — that’s definitely the exception, not the rule. The historical rule is that 10%+ corrections occur every 12-18 months on average.
In other words, we were way overdue — by historical standards — for the type of volatility and pullback we’ve had over the past several days. Another way to say that is this is normal. This is the type of volatility you have to expect when investing in stocks.
Looking back, looking ahead
If the reasons why the market has pulled back lately aren’t helpful, can we at least glean any useful information about what the market is likely to do next? Unfortunately, the answer to that is also no. It’s worth noting that the "longest streak without a 5% correction" record that the current market just recently broke ended in the mid-1990s, with the market about to go on a run of multiple 20%+ gaining years. I definitely don’t expect a repeat of that, but mention it just to illustrate that this record being broken doesn’t necessarily mean further declines are looming.
No, unfortunately, we’re in basically the same place we were at the beginning of the year.
That’s true in a literal sense — after the declines of the past week, the Dow is now down -0.4% in 2018, while the Wilshire 5000 (the broadest U.S. market index) is down -1.1%. In other words, February’s decline has basically only wiped out January’s gains. Take another look at the chart above for context regarding the recent losses and the gains that have preceded them.
But it’s also true in a figurative sense. Stock valuations remain among the highest ever recorded (surpassed only by those at the height of the dot-com bubble). Inflation is showing the faintest signs of getting up off the mat after a decade-long siesta. Bond yields have been rising and are clearly vulnerable given the strengthening U.S. and global economic picture. The Fed continues to gradually raise interest rates in an effort to "normalize" yields after a decade of keeping them unnaturally low.
Those are the risks. And I suspect that eventually, those factors will combine in the Fed going too far, too fast with the interest rate hikes. Which will tip the economy into a recession and stocks into a bear market. That’s not really a brilliant prediction — it’s basically how the story almost always has unfolded in the past, making it a better-than-average guess of what to expect this time around.
But for now, there’s no reason to expect any of that imminently. The economic signs are as strong as they’ve been in years. And importantly, when you look back at historical bear markets, the ones to fear are the ones that are accompanied by recessions. Bear markets without recessions sting, but they don’t tend to last long and go deep. It’s when a bear market is accompanied by a recession that things get ugly. So to the extent that recession seems a distant threat, so too is the likelihood of a deep bear market. Which likely bodes well for the action of the past week being a short-term blip.
Of course, no one knows what the future holds. Every bear market begins with a few bad days and grows from there, so maybe we will look back at this as the beginning of the end. As an investor, you have to recognize this bull market is nine years old, and basically be prepared to withstand the worst.
As we’ve been preaching for some time now, while valuation doesn’t help us much in terms of the timing of the next bear market, it does give us a strong clue about the degree of loss that will be required to get stock valuations down to levels where investors find them attractive again. Like a rubber band, the further market valuations get stretched, the more violent the eventual snapback is likely to be.
Taking it personally
Which brings us back around to the main points of Matt’s post yesterday. The recent pullback may not be instructive for us generally in terms of what it means for our future prospects. But it may be extremely instructive for you personally, if it has revealed that you’re invested too aggressively for your true internal risk temperament. If you’ve been excessively anxious about the 7% decline over the past week, that’s a strong clue that your portfolio is invested too aggressively.
Remember, most of the big mistakes investors make with their portfolios happen during bear markets. If dialing down your risk now allows you to stick with your plan so you’re still invested and able to take advantage of the opportunities at the beginning of the next bull market, that’s a win.
SMI’s Dynamic Asset Allocation and Upgrading strategies have downside risk protection built into them that should help limit your downside in the next bear market. Now is the time to evaluate your portfolio’s risk exposure and whether that’s a match for your temperament. The events of the past week may have been just the wake-up call necessary to help you avoid a much bigger problem down the road.