

Everyone take a deep breath.
It’s been ugly out there the past three days. Four months into this bear market, we finally got the first whiff of real fear and perhaps a little capitulation selling yesterday. There are two things that make me think that: 1) yesterday’s volume was significantly elevated while the market was falling hard, and 2) we finally had our first glimpse of a "flight to safety" rotation out of stocks and into bonds.
Unfortunately — and I really hate to say this — but I think this gets a lot worse before it’s over. We’ll get into that in a moment.
First though, there’s good news for anyone following the SMI strategies. Let’s quickly run through some recent numbers to get some big-picture perspective. In the tables below, I’m breaking out Bond Upgrading separately, as the 50/40/10 strategy line assumes 100% stocks in the Upgrading portion (no bonds). If you’re a newer reader and aren’t familiar with SMI’s 50/40/10 strategy, I encourage you to read Higher Returns With Less Risk, Re-Examined for a full explanation, but we’re using it here as a short-hand estimate of what a blended SMI portfolio would look like (even though many SMI members modify their holdings from the 50/40/10 starting point).
Here’s the damage from last Thursday and Friday (5/5-5/6):
Bond Upgrading | -0.5% |
50/40/10 | -1.5% |
S&P 500 | -4.1% |
Nasdaq | -6.3% |
The SMI strategies provided pretty impressive insulation from the broader market damage.
Here’s what the numbers look like when we add yesterday, a day in which our Sector Rotation (SR) energy holdings finally got marked down sharply (5/5-5/9):
Bond Upgrading | -0.6% |
50/40/10 | -4.2% |
S&P 500 | -7.2% |
Nasdaq | -10.4% |
And let’s widen the lens a bit more to go back to March 30, the beginning of this most recent leg lower (3/30-5/9):
Bond Upgrading | -1.7% |
50/40/10 | -7.7% |
S&P 500 | -13.7% |
Nasdaq | -20.5% |
There are several takeaways we can draw from this series of tables.
The SMI strategies have done a great job insulating us from the losses of the broader market. The last table shows that most clearly. (We’ll have a video update out for members early next week that will delve into this in greater detail.)
While the SMI strategies have protected our portfolios well overall, there are still going to be days like yesterday when we take some hits.
Despite this being the worst year on record for bonds generally, SMI’s Bond Upgrading has held our bond losses to a minimum. That should be one of the strongest takeaways from these tables: bonds are still doing their primary job of insulating our portfolios from losses. At every interval, including a bond allocation in your Upgrading holdings has improved overall returns, which is exactly what we would expect during a bear market. It’s easy to hear/read things about how poorly bonds are performing and assume they’re a bad place to be. That’s definitively not been true of SMI Bond Upgrading.
The rotational aspect of this bear market is on full display, as the tech-heavy Nasdaq index continues to get pounded, while the type of value-oriented stocks we own in SMI’s Stock Upgrading portfolio are losing much less. Until yesterday, our energy stocks (in SR) were positive through this latest April/May leg lower, and even after yesterday’s reckoning, were down just -0.9% since March 1 (and still +17.6% since we bought them at the end of January).
Let’s zoom all the way out and look at the year-to-date numbers through yesterday (1/1-5/9):
Bond Upgrading | -4.2% |
50/40/10 | -8.8% |
S&P 500 | -15.9% |
Nasdaq | -25.7% |
SMI investors with a decent portion of their Upgrading holdings allocated to bonds are down half that (or less) of the S&P 500 index so far this year. And, of course, the S&P 500 is down considerably less than the rest of the broader stock market.
Keep in mind that SMI’s trend-following strategies always take time to adjust to new trends. Our portfolios started this year in a relatively aggressive growth posture, based on the huge gains markets posted last year. That meant we had very little defensive positioning in our portfolios during January. Since then, we’ve incrementally dialed up our defensive team, including the latest moves at the end of April that added 20% and 33% cash respectively to two of our three main strategies. Add to that the fact that I suspect bonds to be much better performers going forward as the dominant market narrative shifts from runaway inflation to falling growth and recession watch.
Simply put, we’re in much better shape to defend against falling markets today than we were even just a few weeks ago. The first table above (last Thursday/Friday) really reflects that.
Still a long way to go
Starting last December and continuing through the SMI newsletter’s May cover article, I’ve built the case for why a bear market was likely and why I don’t think this will be the type of shallow correction that has characterized most of the 2009-2021 period. Summarizing those views as succinctly as possible, we’ve got 13 years of stimulus excess built up into the valuations of financial assets, and the resurgence of inflation has finally put the Fed in a position where they need to stand aside (finally) and let some of those excesses be removed. After intervening to stop every recent attempt of investors to clear these valuation extremes (2016, 2018, 2020), the Fed is finally out of the picture, at least briefly.
I want to return briefly to two charts we’ve featured in the past. The first is an updated version of the "Buffett indicator" which I’ve highlighted a few times before. The red circle shows where this chart stood when I wrote What Tesla & Buffett Tell Us About the Market on February 12, 2020, exactly a week before the market would begin the COVID plunge. At that time, this indicator measuring the size of the U.S. stock market as a percentage of U.S. GDP stood at 156%, which I pointed out had eclipsed the 2000 "dot-com" bubble high and was cause for concern.
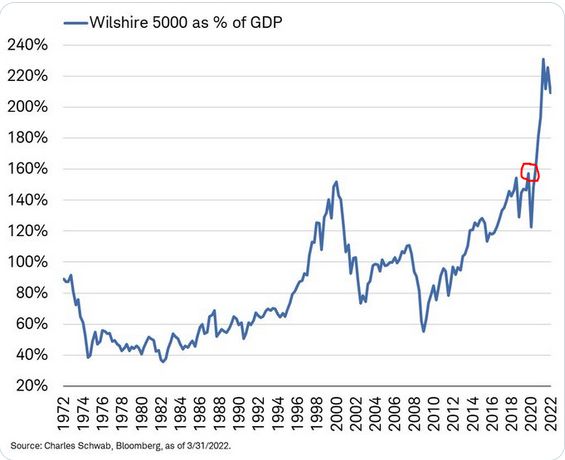
The chart shows that valuations have corrected a bit during this year’s decline, taking this indicator down from ~230% to ~210%. But this chart showed the highest valuations in history at 156%! This is the sort of thing that makes me think we’re nowhere near the end of this bear market. The excesses have only just begun to be wrung out.
The weekend before last, a pair of tweets made me sit up straight and take notice. First was a short thread by Bill Gurley, who is one of the top venture-capital guys around. These are basically the "pre-public listing" (often tech) companies that go on to become the Googles, Facebooks, Amazons, etc.
An entire generation of entrepreneurs & tech investors built their entire perspectives on valuation during the second half of a 13-year amazing bull market run. The "unlearning" process could be painful, surprising, & unsettling to many. I anticipate denial. Some thoughts:
— Bill Gurley (@bgurley) April 29, 2022
That grabbed my attention when I first saw it Saturday morning. But my eyebrows really raised when I saw this follow-up from Amazon founder, Jeff Bezos, the following day:
Bill is without doubt one of the smartest people I know and always worth listening to. Most people dramatically underestimate the remarkableness of this bull run. Such things are unstoppable … until they aren’t. Markets teach. The lessons can be painful. https://t.co/4DjgEvr0tg
— Jeff Bezos (@JeffBezos) April 30, 2022
A bit of context to Bezos’ affirmation of this idea: Amazon was already a top tech darling by the end of the late 1990s tech bubble. Bezos was Time magazine’s Man of the Year in 1999. We all know what Amazon has gone on to become in the two decades since. Yet Amazon would fall -91% between March 2000 and October 2001. So Bezos has deep, personal experience with what can happen when ridiculous overvaluation smacks headlong into a market liquidity regime change.
Since we’re reminiscing about the 2000-02 dot-com bust, consider this iconic quote from Sun Microsystems CEO, Scott McNealy, from a few years after that bubble had burst. He points out how at a certain valuation it’s impossible to make the numbers work no matter how great the company is. Sun MicroSystems stock was $5 in 1996, increased more than 10x to the $64 peak mentioned in the quote, and was back at $5 by 2002:
At 10 times revenues, to give you a 10-year payback, I have to pay you 100% of revenues for 10 straight years in dividends. That assumes I can get that by my shareholders. That assumes I have zero cost of goods sold, which is very hard for a computer company. That assumes zero expenses, which is really hard with 39,000 employees. That assumes I pay no taxes, which is very hard. And that assumes you pay no taxes on your dividends, which is kind of illegal. And that assumes with zero R&D for the next 10 years, I can maintain the current revenue run rate. Now, having done that, would any of you like to buy my stock at $64? Do you realize how ridiculous those basic assumptions are? You don’t need any transparency. You don’t need any footnotes. What were you thinking?
It’s never wise to focus too much on any one valuation metric, but it’s worth pointing out that a full 15% of the S&P 500 companies started this year with price/sales ratios of at least 10, the "what were you thinking?" level McNealy spoke about (10 times revenues). While the forward price/sales ratio for the S&P 500 index as a whole has declined from just under 3 to below 2.5 now, this metric was ~0.5 at the market bottom in 2008-09. Again, valuations became so extreme during the past 13 years of massive liquidity that the declines we’ve seen so far this year have barely begun to swing back.
Bear markets don’t move in a straight line
The second chart is one I’ve referred to a few times before. It’s the path of the 2007-09 bear market, with each decline and counter-trend rally clearly marked in percentage loss/gain terms.
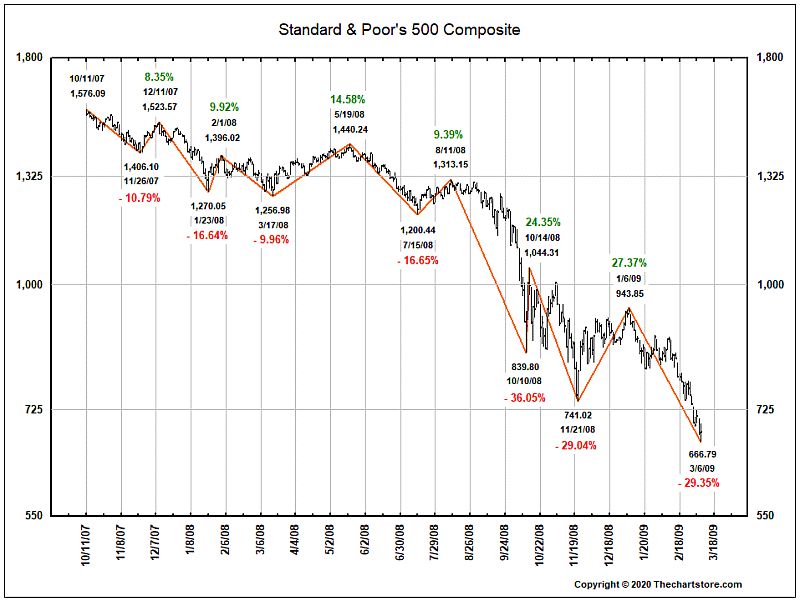
Every bear market is different, so we don’t want to fixate too closely on the specifics of past bear markets. But when we look at a number of past bear markets, certain patterns do emerge. One I’ve highlighted in the past is the tendency for bear markets to follow a "1/3 – 2/3" pattern, where the first two-thirds of a bear market in time tends to only do one-third of the total damage, while the final one-third in time does two-thirds of the damage. Yuck.
A more immediate point to glean from this chart is the dramatic strength of the counter-trend rallies. We’ve already seen this during this year’s bear market, most recently from March 14-30, when the S&P rallied +9.5% in basically two weeks. Look at the first two rallies (the green numbers) in the chart above...+8.35% and +9.92%. This March’s +9.5% rally fits perfectly. Some of the rallies in the chart above are super-short and vertical (like the 1/23/08-2/1/08, +9.92%) while others are more drawn out (like the next one, which lasted from mid-March ’08 to mid-May while gaining +14.58%).
The point is simply that as scary as the market has been lately, it really doesn’t tell us much about what happens next. Could the market go over the waterfall here? Sure, but it could just as easily bounce +10-15%. That type of rebound from such oversold conditions shouldn’t surprise us in the least.
The short term is impossible to predict, the longer-term less so
All of this is why SMI firmly believes that navigating bear markets successfully requires a deliberate process. Bear market rallies don’t require a catalyst. Sometimes stocks rebound simply because sellers get temporarily exhausted. Other times there is a catalyst (lower than expected inflation figure tomorrow?), but that catalyst is eventually overwhelmed by the developing bigger story (slowing growth and global recession watch overtaking the inflation fixation?).
The good news is if you’re following the SMI strategies, you already have such a process. We’ve nailed the "narrative" pretty closely through this market cycle, and with the most recent adjustments at the end of April, our portfolios now reflect a robust defensive posture. This gives us a solid stance both to weather whatever is left of this bear market as well as to eventually begin the incremental process of re-deploying funds back into the market.
This isn’t SMI’s first bear market. It’s been a while since we’ve had a lasting one, but we know our process works. If you’re following it already, take a deep breath and trust the system. If you’re not following it already, I highly encourage you to consider it. While we likely will get a decent rebound sometime soon, I strongly suspect this bear market ultimately heads considerably lower before it’s over.