

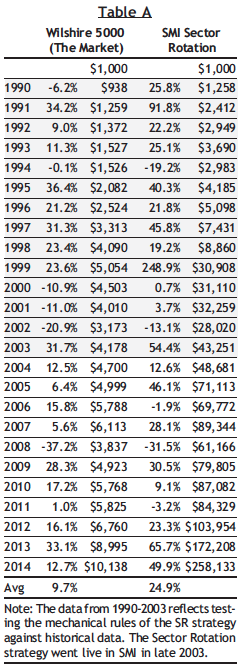
Welcome to this primer on Sound Mind Investing’s most aggressive (and profitable) strategy. As we get started, look at Table A below. See the “SMI Sector Rotation” column? The one that shows average annualized returns of 24.9% over the past 25 years? The one that shows $1,000 growing into $258,133?
That’s the strategy we’re going to discuss in this article. Just wanted to make sure we have your full attention!
Before diving into an explanation of how those results were obtained, let’s set the stage with a little background on sector funds. Sector funds are special-purpose stock funds that invest in a very narrow slice of the economy. Most commonly, they include such specialized investing themes as technology, health services, precious metals, natural resources, financial services, and real estate.
Investors in sector funds are buying into a concentrated portfolio that focuses on a particular sector of the economy. As the economy moves through the ups and downs of the business cycle, conditions favor certain types of businesses/industries at certain times. In other words, all the sectors don’t rise and fall together.
When the sector in which a fund specializes is doing well, the results can be sensational. By the same token, when tough times hit that sector, the fund suffers along with it because the manager lacks the flexibility to switch to something else. Thus, sector funds live a sort of “rags or riches” existence, which explains the fact that the average sector fund is about 50% more volatile than the market in general.
So what’s needed is a methodology that allows you to invest in a sector fund during its period of popularity but then alerts you when the ride is over and it’s time to move to another sector that’s doing well. In other words, an approach similar to the one we use in our Fund Upgrading portfolios.
Years ago, we set out to see what would happen if we applied our momentum rankings and “top quartile” buy/sell rules to sector funds.
We began testing in 1990, which is ancient history as far as sector funds go. There were only 22 no-load sector funds at the time. Our rules should sound familiar: (1) Compute each fund’s momentum score by combining its 3-month, 6-month, and 12-month performance numbers; (2) Rank the funds according to their momentum scores; (3) Begin by buying the top-ranked fund; (4) Continue to hold that fund as long as it ranks in the top 25% of the group; (5) When its momentum score falls out of the top 25%, replace it with the fund that’s top-ranked at that time; and (6) Keep doing this over and over.
It soon became clear the gold funds were ruining everything. They tended to rocket to the top too quickly, and, after a few months, falter quickly. (That could be due to the fact that, more than any other group, gold funds tend to be bought because of emotional and geopolitical considerations.) We reran the test, excluding the precious metals funds. This time, the results were very good — but we thought they could be better. Because of the volatility of sector funds, the system needed to react to changes in performance leadership a little bit more quickly.
We decided to change the basic momentum formula to include the most-recent one-month return as well. So, bear in mind that when we’re talking about momentum as it relates to sector funds, we’re not referring to the momentum scores that appear in the Personal Portfolio Tracker (those are based on the 3-, 6-, and 12-month numbers only). This change led to the sensational results you see in Table A at right. Even if you remove 1999 where the strategy recorded a remarkable gain, the average annual return is still 18.8%, almost double the 9.7% turned in by the overall market. (Transaction fees, which depend on the broker, the length of time a fund is held, and the size of the transaction, are not included. On average, funds were held a little longer than nine months.)
That’s the good news. The bad news, as can be seen in Table B below, is that the results vary all over the lot. Here’s how we ran the calculations. After looking at the results from buying on January 1, 1990, and holding for, say, one year, we then “rolled” to the next month to see what happened if the fund had been purchased on February 1, 1990, and held for one year. Then we moved to March 1 and did the same thing. And so on through the end of 2014.
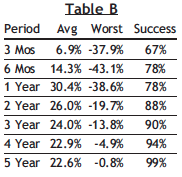
We used this “rolling periods” approach for all the time periods shown in Table B. Using this more exhaustive process provides a better picture of the degree of volatility and level of returns that can be expected versus using only calendar-year data.
The result from the SR strategy over the average 12-month period from 1990-2014 was a gain of 30.4%, but the worst such period saw a 38.6% loss. Not everyone could stomach losing one-third of their capital or more in a single year (or even worse, as little as three months!). Fortunately, the strategy is fairly consistent, turning in profits in 78% of the 12-month periods tested and beating the market in 20 of the past 25 years.
In sum, this strategy comes with a strong warning label: The results can be dramatic in both directions. Since we first reported on this strategy in November of 2003 and started making real-time Sector Rotation recommendations, we have gained over 100% on a single fund, but also lost at least 10% on three separate occasions. (The gray section of Table A shows the backtested period, the unshaded section shows the live results.) Of the 14 funds recommended over the past 11+ years (through 2014), eight have made money and six have lost — although the winners far outweigh the losers, and the strategy has gained a total of 478.9% overall since it was launched.
As veteran readers may have noted by now, this kind of aggressive strategy falls outside SMI’s primary “diversify and go slow” emphasis. It’s designed to be a complementary add-on strategy, a way to invest a relatively small portion of a portfolio (not more than 5%–15%), with the balance broadly diversified among our other core strategies. You shouldn’t use it as your main component.
Given its incredible track record, Sector Rotation is SMI’s most popular add-on strategy and is included with an SMI Premium-level membership. Monthly updates are posted to the SMI website on the last trading day of each month (premium members can also sign up to have an email alert sent to them when the strategy is updated each month).
The additional fee to upgrade from a Basic membership to Premium seems to be a small price to pay to gain access to Sector Rotation’s extremely strong returns. In fact, in 2014 alone the profit difference between investing just $10,000 in Sector Rotation instead of the overall market was enough to pay for a $16.95 monthly SMI premium membership for the next 20 years!
Sector Rotation is obviously a more volatile approach than SMI’s other strategies. But for those willing to accept some significant ups and downs along the way, the rewards have been exceptional.