

The stock market has been on quite a tear over the past few months. The S&P 500 index is up +11.3% since the third Fed rate cut happened last October 30, a span of about 3.5 months. It’s up a whopping +17.2% since the October 8 low, right before the Fed ramped up its "not QE" Treasury Bill buying program alongside providing huge overnight liquidity to the Repo market, both of which continue to this day.
Let’s take a quick look at how those numbers compare to similar situations in the past. There have been four other times in the past 25 years when the Fed has cut interest rates at least three times. The last two, in 2001 and 2007, the economy worsened and fell into recession, and the stock market tumbled. After the third rate cut in 2001, stocks fell -12.6% over the following year, while after the third cut in 2007 stocks plummeted -42.4% over the following year.
However, the two cases prior to those worked out quite well for both the economy and stock investors. In 1996 and again in 1998, a series of three rate cuts helped sustain the economic expansion, propelling it to become the longest (at the time) expansion on record (it has since been eclipsed in length, though not magnitude, by the current expansion). Stocks were up +24.8% following the third cut in 1996, and +19.4% following the third cut in 1998.
So the big differentiator between these two very different experiences was whether or not the economy slipped into recession, necessitating further cuts. The good news on that score is there is little to indicate the U.S. economy is in any imminent danger of slipping into recession. The not-so-good news on that front is the Fed Funds market currently shows a 70% chance of further cuts by September. Time will tell whether that comes to fruition.
If the economy does avoid a recession through the rest of the year, the two 1990s examples indicate there could be some further upside ahead, although how much is a reasonable question. Of course, the current scenario could far exceed either past example, an idea that seems even more plausible given the extraordinary liquidity support being provided daily by the Fed. But it’s worth noting that if we measure back to the beginning of the Fed "big interventions" in early October rather than the third rate cut specifically at the end of the month, we find that the market has gained nearly as much already in the past 4.5 months as it did in the full year following the 1998 cuts. And the market’s 4.5-month gains are within 7.6% of what the market accumulated in the full year in 1996.
Again, that doesn’t mean this market has to stop there just because our last two prior examples did. But it does help put the recent gains in context to see them outpacing even these two incredible examples from the late-1990s dot-com era.
Beneath the surface cracks are forming
We’ve been talking for some time about the stock market being richly priced by historical standards. I wrote about a few of these valuation metrics last week, and whether you use a longer-term measure of valuation like the 10-year, backward-looking CAPE P/E ratio or the current forward P/E ratio (below), the message is the same: the stock market hasn’t been this expensive since the all-time valuation highs of the dot-com era 20 years ago.
The S&P 500’s forward P/E ratio is at a 17-year high, @FactSet data shows.
— Rich Kleinbauer (@RMKOutFront) February 9, 2020
Not to worry though, it’s not like there are any unknown catalysts out there to contaminate the healthy environment pic.twitter.com/VgTZ103ixn
One worrying aspect of this rally is the gains are accumulating to fewer and fewer stocks, even within the S&P 500. This is a tendency seen frequently as past market tops approached. Sven Henrich pointed out a week ago that the Value Line equally weighted index (which looks beyond the S&P 500, but most importantly doesn’t overweight the largest company’s stocks the way the S&P 500 and Wilshire indexes do) was still trading well below its January and September 2018 highs.
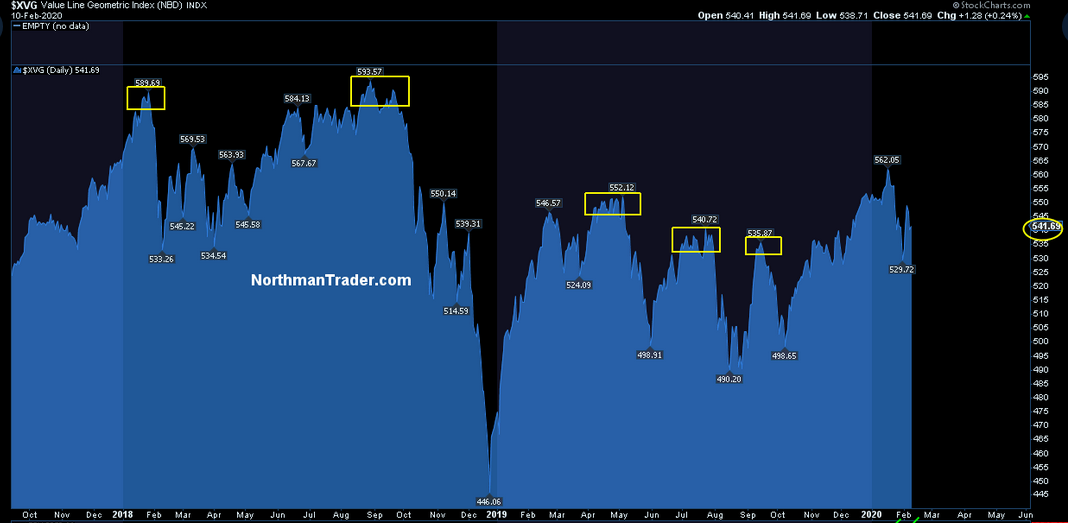
Click Graph to Enlarge
Others have pointed out similar trends that are typical late-cycle indicators:
Yet Andrew Sheets, chief cross-asset strategist at Morgan Stanley, says there are late-cycle indicators in current markets.
“Historically, in the ‘downturn’ phase of our indicator, long-dated bonds outperform stocks. Defensive and large-cap equities (modestly) outperform cyclicals and small caps. U.S. stocks (modestly) outperform those in the rest of the world. Investment grade credit returns more than high yield. Precious metals outperform other commodities. All have been happening, not just year-to-date, but for the better part of a year,” he wrote in a note to clients.
The S&P 500 (large-company stocks) has gained 22% over 12 months, compared with just 8% growth for the Russell 2000 (small-company stocks) and a 10% gain for the MSCI World ex-USA (foreign stocks).
Normally I’d throw economist David Rosenberg in the penalty box for cherry-picking his data in the tweet below, but he escapes by making a really important point. As we’ve noted recently, the bond market has been shouting (via falling yields) loudly this year that it doesn’t believe the rosy scenario of future growth being painted by the S&P 500. Commodity prices, which tend to be very economically sensitive, have been falling alongside bond yields, confirming this pessimistic forward-looking view.
Rosenberg makes the point that, apart from the S&P 500 index, which is itself rapidly-narrowing in terms of how many stocks are participating, the rest of the stock market is largely confirming the cautionary view of the bond and commodity markets.
Small-cap stocks excluding the uber-defensive utilities sector are flat from a year ago and off 12% from the highs. So, in actuality, the equity market is predicting the same U.S. slowdown/recession the bond and commodity markets are!
— David Rosenberg (@EconguyRosie) February 19, 2020
When in doubt, follow the system
As we often remind members, the predictive investing game is a tough way to play. For every positive, there’s a negative, and for every expert saying the next move will be down, there’s another saying it will be up. It’s not hard to imagine a future where the coronavirus slows global growth enough to tip a slow-growth world into recession. But you know the central banks would open up the liquidity fire hoses even more, racing each other with future rate cuts in a modern-day version of "how low can you go?" The bond market seems focused on the economic risks, while the stock market is pinning its hopes on the Fed being able to rescue it from any economic danger. The Fed has won every battle over the past decade, but history tells us they always eventually lose the war (2000, 2008, etc.). The question is when.
So since we can never know what the future will hold, we aim to help you stay aware of the current market dynamics via posts like this. But we aim to help you stay invested according to the mechanical, trend-following systems SMI has created. They have been constructed in such a way as to alert us when the market trends have already actually changed, as opposed to trying to predict future changes, and to position us accordingly so we stay on the right side of the extended market trends.
It’s the best solution we’ve found to trying to navigate the big market moves, such as the big bear markets in 2000 and 2008, as well as the big rallies of the mid-2000s and the past decade.