

Over the past 50 years, much research has focused on the specific factors that contribute to investment returns. Some of the most prominent factors are already familiar to SMI readers. For example, the Size and Value factors form the basis of SMI’s Stock Upgrading risk-category framework, dividing the fund universe along two axes: large vs. small companies, and value vs. growth management styles.
Most investment professionals are comfortable with the explanation that higher risk accounts for the slightly higher historical returns smaller stocks have earned over larger ones, as well as from value over growth stocks. This explanation is in keeping with the efficient market hypothesis, which argues higher returns shouldn’t be available without higher risk being taken.
A third investing factor familiar to SMI readers breaks with this risk/return tradeoff explanation, however. This is the Momentum factor, which underlies all of SMI’s active strategies. Called “the premier market anomaly” (deviation from the norm) by no less than Eugene Fama, who won a Nobel prize for his work on the Efficient Market Hypothesis, momentum has confounded researchers because it persistently works despite no obvious explanation as to why it works.
There is a fourth widely recognized investing factor, which shares with the momentum factor its status as an anomaly. Jeremy Grantham calls the Quality factor “the greatest aberration of all time in the markets.” Yet researchers struggle mightily to explain why it works.
The Quality factor clearly contributes excess returns and is robust across multiple asset classes (especially prominent in equities and junk bonds), yet it flies in the face of the idea that excess returns should only be available by taking additional risk. Perhaps even more so than the conundrum surrounding momentum, the Quality paradox is especially perplexing given that lower risk is central to this specific market anomaly, yet its use results in higher returns.
Defining “Quality”
As with the Value factor, there are a number of different criteria that researchers and investors use to define it, and consequently, it lacks a single universally accepted definition. But generally speaking, high-quality companies are those that exhibit high and stable profitability across the business cycle, while possessing strong corporate balance sheets. One study might focus on a minimal use of leverage and another on a company’s return on invested capital, but the general idea is the same. Again turning to Jeremy Grantham, whose GMO firm has done as much work as anyone on the Quality investing factor over the past 50 years: “The essence of a Quality stock is a high stable return on equity and an impeccable balance sheet.”
Some might counter that seeking out these types of companies is obvious. However, this is far from the case. Investors have a long history of chasing more speculative, “junkier” companies, especially as investor optimism grows. The dot-com bubble in the late 1990s was a poignant example of investors chasing stocks with little (or no) earnings based on the promise of what they might grow into. We saw a similar surge of speculative optimism in 2021 as meme stocks and cryptocurrencies soared. Boring, stable companies often pale next to new, exciting future growth stories.
As noted earlier, one would expect that taking the safer, lower-risk route of investing in such stable Quality companies would carry a cost of earning lower returns. But that’s exactly the opposite of what the data shows. It’s why the Quality factor is an anomaly.
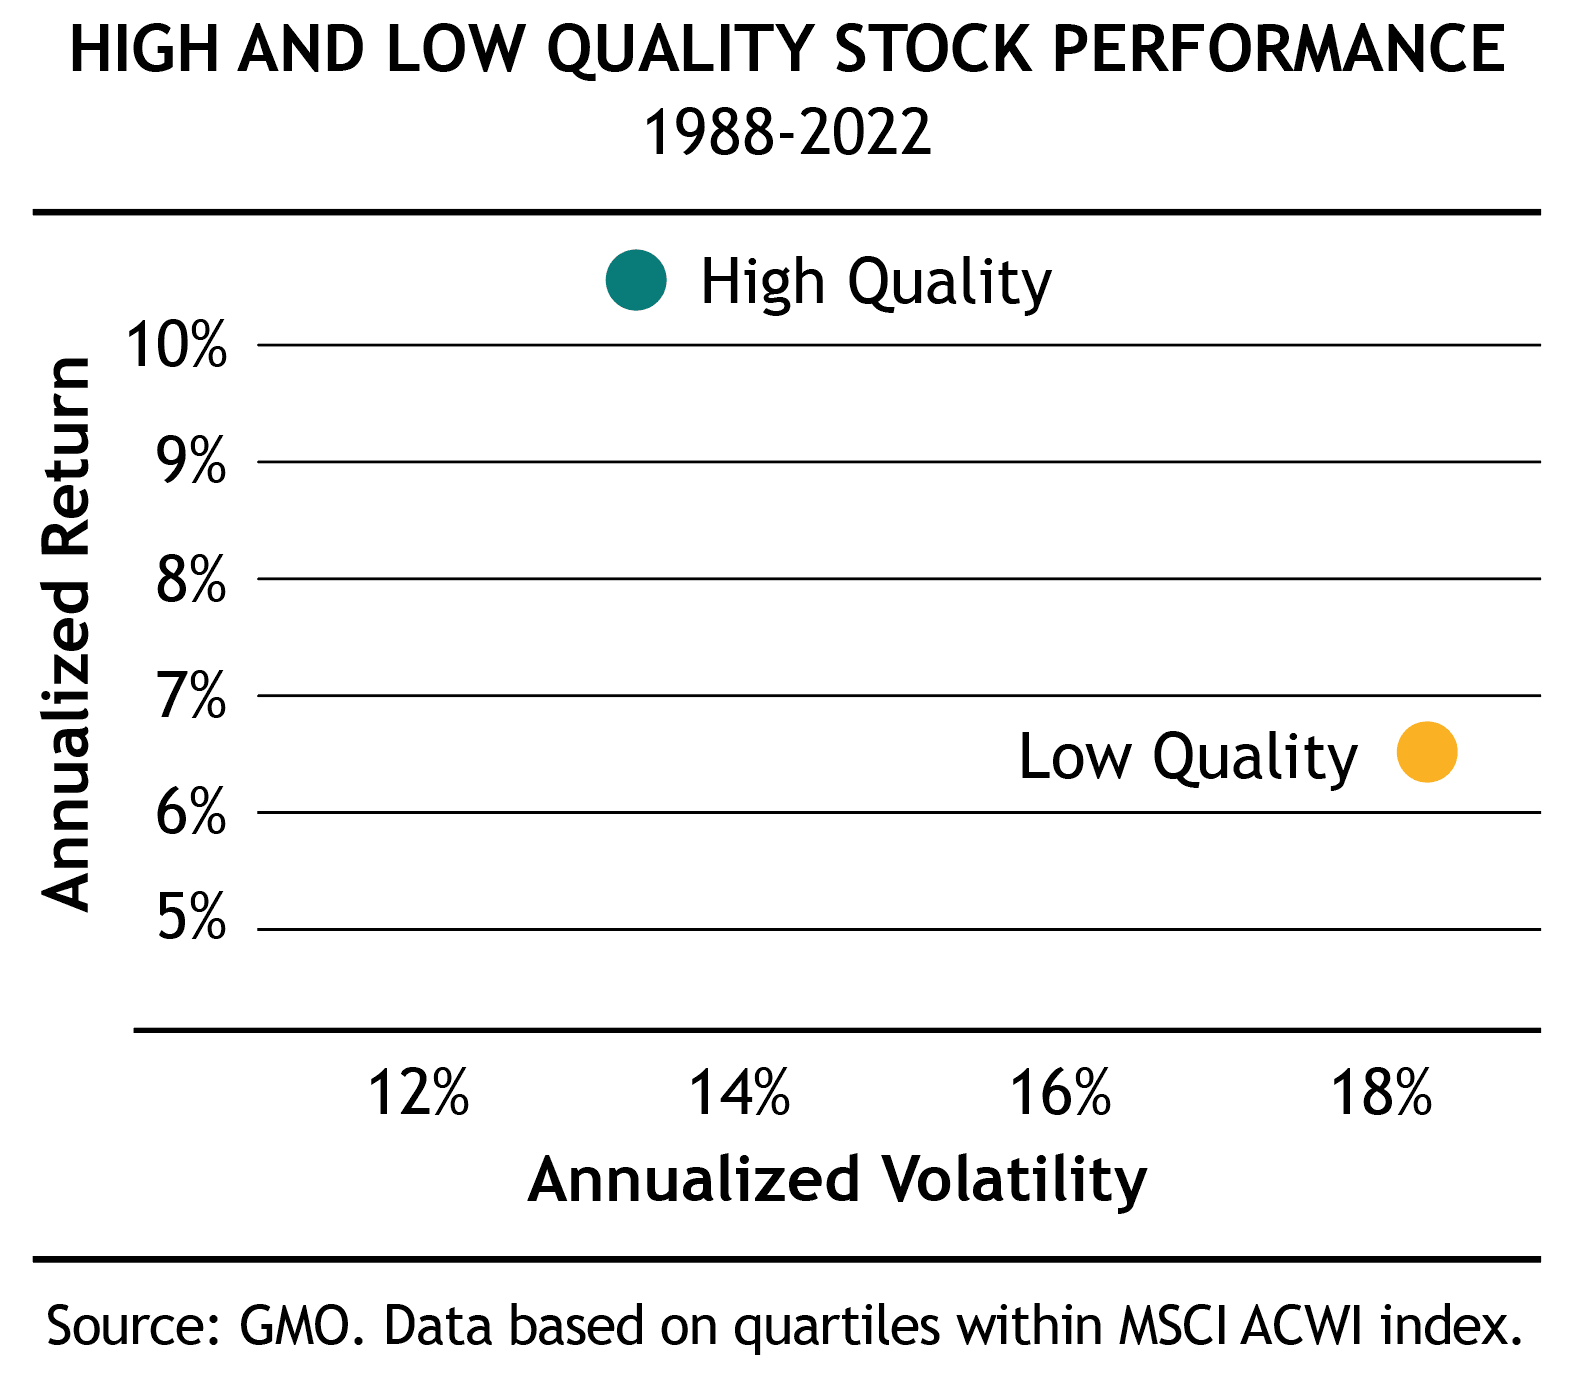
The table on the right, published by GMO’s Ben Inker in his 4Q 2023 client letter, shows this clearly.
GMO simply took the global MSCI ACWI stock index and divided it using GMO’s proprietary Quality model, defined as “those [companies] with high profitability, low profit volatility and minimal use of leverage.” The top 25% of companies are shown as the High Quality dot, while the bottom 25% are shown as the Low Quality dot.
The Efficient Market Hypothesis argues that taking less risk and enduring lower volatility should come at a performance cost. Yet the chart shows the exact opposite. High Quality provided both lower volatility and better performance — by more than 4% annually. Inker called the result, “utterly counterintuitive, astonishing, and demands to be incorporated when building sensible equity portfolios.”
So why doesn’t everyone do it?
Given that the Quality factor is well known and has been studied at length, why doesn’t everyone already invest this way? As we’ve discussed, the siren song of the next great growth story is one reason that investors are drawn to more speculative investing choices.
So, too, is the historical tendency for Quality to slightly underperform during bull markets (while massively outperforming during bear markets). Given that stocks are in a bull market most of the time (roughly 75% by some measures), it’s tough for managers to fill their portfolios with stocks they think are likely to lag as the market rises.
This is where work from 3Fourteen Research is illuminating. Their work on the Quality factor shows that while Quality may technically underperform across bull markets, that lower performance is largely attributable to the periods immediately following bear markets.
In that initial move up from a bear market bottom, the most speculative, “junkiest” stocks tend to perform the best. This makes sense as they have typically been beaten down and left for dead by that point, so the change in the market’s fortunes impacts their prospects the most. Quality stocks, in contrast, have normally held up much better than other stocks, so their rebound off the market bottom is less pronounced.
However, 3Fourteen shows this lagging performance for Quality stocks doesn’t persist throughout the rest of the bull market after this initial phase. This leads them to conclude that Quality stocks outperform throughout most of the market’s cycle, except for the six-month period immediately following a bear market low. As such, investors can simply ask, “Has the market just suffered a big decline of 15-20% or more?” If the answer is no, chances are good that Quality stocks will outperform.
The best way to apply the Quality factor in portfolios
In the past, SMI hasn’t focused specifically on incorporating the Quality factor into our model portfolios, opting instead to allow it to move in and out of our Stock Upgrading portfolio via the normal fund momentum process. There are roughly two dozen ETFs that tout “Quality” in their names and we have a handful in our fund universe to draw from as their momentum scores dictate.
But what if there was a way to marry the two anomalous factors we’ve discussed in this article and, in so doing, get the best of both the Quality and Momentum factors? Identifying Quality stocks that are already strongly trending higher seems like a potent combination. Fortunately, a systematic approach to do exactly that has been created: Full-Cycle Trend: Upgrading for Individual Stocks.