

It's CPI day, the day we find out how much prices have increased over the prior month. This has become a high holiday each month on investors' calendars because it's believed that a sufficient weakening of this number will provide investors with valuable gifts — specifically, the long-anticipated Fed pivot from raising interest rates to cutting them. And as anyone who invested during the 2010s remembers, Fed rate cuts = stock market goes to the moon.
If you sense a little sarcasm there, it's because this whole process has become a bit overblown. Yes, the CPI is important. But after peaking at an annualized rate of 9.1% last June, it's become quite clear we've been in a period of disinflation ever since. So whether the annualized rate fell this month to 6.5% (which it did) vs. 6.3% or 6.7%, probably wouldn't have mattered a whole lot in practical terms. Except on Wall Street, where the variance between those high and low figures could have sent stocks up or down by 3-4%.
Investors are cheering the decline in the inflation rate because they believe Fed Chairman Jerome Powell will first pause and then pivot (to cutting rates) as it decreases. There's obviously a correlation between inflation and the Fed Funds rate, but there's also important history to be aware of. I guarantee Powell is aware of it.
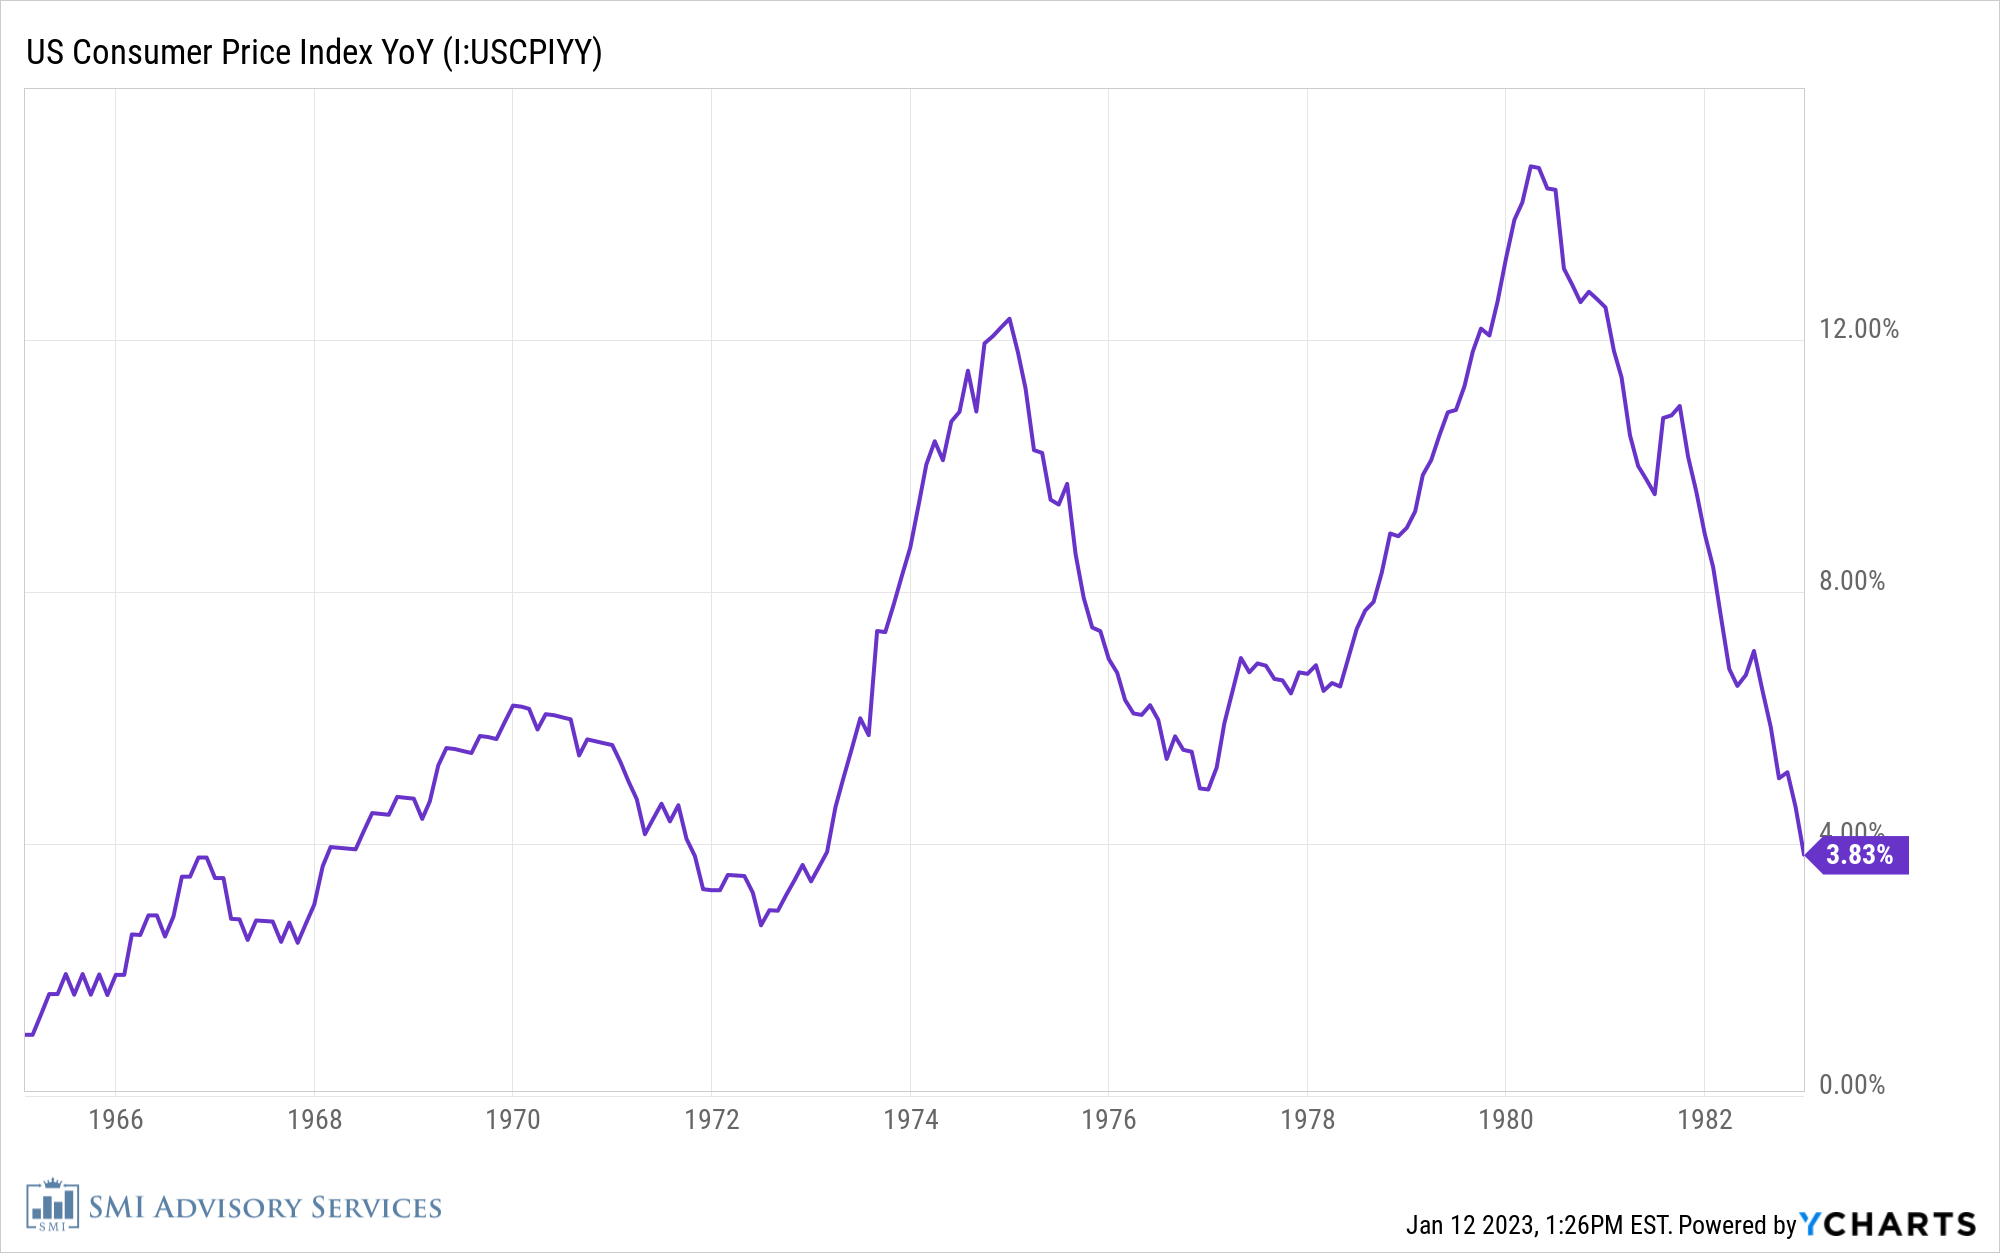
The following chart shows the year-over-year change in CPI from 1965-1982. I suspect this is probably tattooed on the inside of Chairman Powell's eyelids.
 We've all been told a bit of a fairy tale about the inflation of the 1970s. The story goes that the Fed was weak back then, which is why inflation was allowed to rage out of control for so long. Only when the strong Chairman Volcker arrived on the scene with the fortitude to "do what was necessary" did we finally stuff that inflation genie back in the bottle for the next 40 years.
That's a great story, but the reality is more complicated.
Follow along with me as the purple CPI line in the chart above goes through four distinct upward waves, and we'll compare those with what the Fed was doing to the Fed Funds rate.
Wave 1: 1965-1967
The Fed Funds rate was raised from 1.0% in December 1965 to 5.5% by November 1966. (That's not terribly different from the rate hike cycle we're in now, which has seen Fed Funds go from 0.25% early last year to 4.25% today. But we'll come back to that thought...)
That seemed to do the trick, as inflation quickly retreated to 2.5% by April 1967. That's when then-Fed Chairman William McChesney Martin made the decision that today's investors believe Chairman Powell will make later this year: he cut interest rates from 5.5% to 2.0% by July 1967.
Wave 2: 1967-1970
This is where our modern Fed fairy tale goes off the rails, as Martin raised rates from 3.5% in 1967 to 10.5% by July 1969! So much for not having the guts to do what was necessary. And sure enough, annual inflation peaked at 6.2% in December 1969 and started to retreat.
Once again though, the Fed cut the Fed Funds rate, all the way down to 3.75% by February 1971. What idiots, right? Never mind that the Fed was responding to a bruising recession that lasted nearly all of 1970.
Wave 3: 1972-1974
By June 1972, CPI inflation had fallen all the way to 2.7%. Whew, glad that's over!
Unfortunately, the real inflation pain was just beginning. Over the next 2.5 years, CPI would explode higher to 12.3%. Noted historical Fed weakling (no guts), Chairman Arthur Burns, would counter by raising rates from 3.75% in February 1971 to 13.5% by July 1974! (Remember, Fed Funds is at 4.25%-4.50% today and investors are begging for a pivot!)
Once again, high rates knocked inflation way down, from 12.3% at the end of 1974 to 4.9% by late 1976. It also knocked the stuffing out of the economy, with a brutal recession that lasted from late 1973 to early 1975. Not surprisingly then, as inflation fell, the Fed once again cut rates, so that by April 1976 Fed Funds was back to 4.75%.
Wave 4: 1977-1981
This is the big wave everyone remembers, sending CPI to a whopping 14.8% in March 1980. Paul Volcker, the hero of our modern story, was in the saddle at that point and he bravely pushed Fed Funds to 19.0% that same month.
A funny thing happened next though, which has been scrubbed from the narrative. Tall Paul apparently blinked, cutting rates to 8% over the next five months. Say it ain't so, Paul! Apparently, he wasn't immune to recessions either.
It was only then, despite CPI having come down from 14.8% to 12.9% that Volcker became VOLCKER, cranking Fed Funds to an eye-watering 22% by the end of 1980. Whipping rates around in a way we haven't seen in decades, he'd then cut to 14% by March, then crank them right back to 22% by July. That was the peak for Fed Funds (CPI had peaked way back in March 1980). This pushed unemployment to 10.8% and caused a second dreadful recession — the infamous double-dip of 1980/82.
The Fed is terrified today is 1971
There are a couple of reasons for taking you on that extended trip down memory lane.
The narrative that inflation could have been broken "if past Feds had just been willing to do what it takes" is a convenient narrative that has been used to keep the public from fearing the inflation bogeyman for the past 40 years. It's been a powerful tool, as inflation has a significant psychological component. But as we've just demonstrated, the earlier Feds did have the guts to crank rates to the sky. They simply were responding to the combination of falling inflation and the bruising recessions that kept following these rate-hiking cycles.
It makes clear the rock/hard place dynamic Powell and the Fed are in today. Powell has made it abundantly clear that he is intimately familiar with this 1970s history. He even uses the code words "Keeping at it" in his comments at every Fed meeting, a tribute to his hero Volcker whose autobiography is titled the same.
It's easy to understand why the Fed would look at the 1970s CPI chart (above) and fear that we're reprising the same pattern, with today being 1971. We've got inflation cooling off of an initial spike higher. We've seemingly got a recession heading our way. And investors are pining for a Fed pivot to cutting rates. Bond investors are actually pricing in rate cuts by the end of this year.
Will they get those cuts? I'm not so sure. There's no question Powell wants to be Volcker, not Burns or Martin. But as we just saw, even VOLCKER cut rates during the 1980 recession. Like Volcker, Powell has an early-panic rate-cut cycle on his record that he'd probably like to have back (2019). The question is whether Powell views that earlier "mistake" as his 1980 and the current cycle as his 1982. He's certainly talking that way — "Higher for longer."