

Last week, SMI published How SMI’s Process Helps Investors Buy Low and Sell High, which focused on how our momentum-driven, trend-following strategies handle the market’s big bull/bear turning points. One of the big ideas was that our strategies wait for confirmation of these trend changes before shifting our holdings to reflect the new trend.
By building our models to not respond immediately to every little market wiggle, we can stay on the right side of the big moves without suffering through a ton of whipsaws (i.e., where a brief move causes us to shift our positions, only to have that move fail and we have to shift them back).
The key idea in the article was communicated by the following chart, which shows how our trend-following systems attempt to ride market cycles:
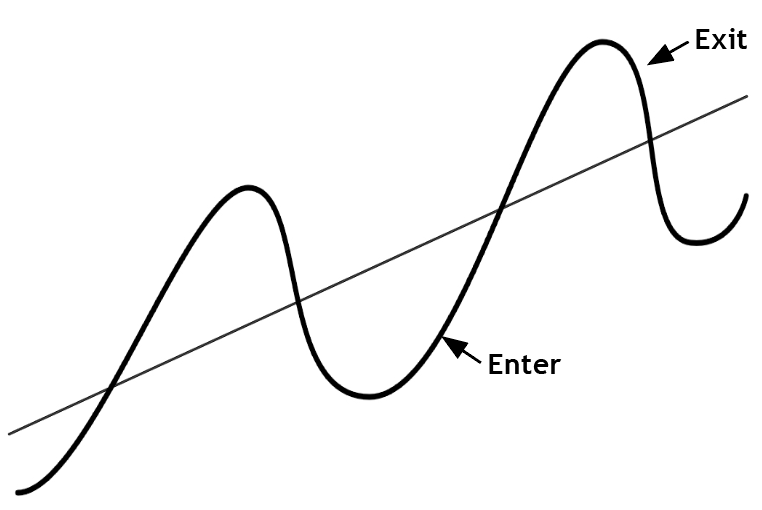
Last week’s article focused on the big market bull/bear cycles. The rare "double-dip" of the 2020 and 2022 market selloffs made for a compact illustration of this cycle-riding idea because the back-to-back peaks were so close together. Usually, however, major turning points are quite spread out. For example, after bottoming in 2009 (the "Enter" point would have been around May 2009) the next market peak didn’t come until February 2020 (with the "Exit" occurring shortly thereafter). That’s a long time in between turning points!
Yesterday, Matt expounded on this idea in his excellent post Momentum and the Market Cycle, reminding us that it’s less common for the SMI strategies to react in a "buy low, sell high" manner, and more common that they are responding in a "buy high, sell higher" manner.
If you think of the diagram above as the long bull/bear cycle with the "Enter" shortly after the bottom in March 2009, and the "Exit" shortly after the top in February 2020 (or January 2022, take your pick), it’s clear that the upward slope in between would have lasted roughly a decade! All along that extended upward slope, SMI’s strategies would have been making trades that weren’t necessarily "buying low" — they were selling one fund (or asset class in DAA) that was exhibiting slowing momentum and replacing it with a fund/asset class exhibiting stronger recent momentum. Thus the "buy high, sell higher" idea as that bull market kept climbing upward for a decade.
Cycles on top of cycles
If you were so inclined, you could easily take the diagram above and draw a smaller version of the same "sine wave" pattern all along the single curved line shown. That would be a rough approximation of the many smaller, shorter-term cycles that are constantly taking place within the longer bull/bear market cycle illustrated in last week’s original article. Those smaller cycles could represent changes between growth stocks and value stocks, higher interest rates and lower interest rates, or even simply the flagging momentum of one small-company value fund vs. another of its peers.
My point is simply that there are many shorter-term cycles taking place — and giving the SMI strategies signals all along the way — while the much bigger-picture bull/bear-market cycle is grinding away in the background.
The big bull/bear cycle is what the strategies are responding to in telling us to very occasionally raise cash (as we did in 2020 and have again this year in 2022). The smaller cycles are what the strategies are constantly responding to in changing funds the rest of the time.
Hopefully, that helps clarify further and hasn’t made things more confusing!
Letting our winners run
Let’s look at a recent example of how staying on the right side of the broader trend allows us to let our winners run, while keeping our losers short.
Below is a chart of the CRB commodities index.
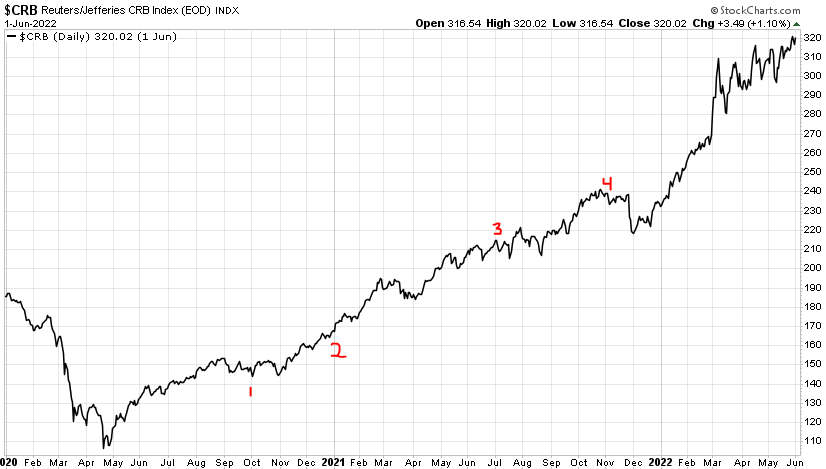
The chart begins in January 2020 and I’ve added labels to illustrate a few points.
The first COVID plunge is obvious on the chart as commodities crashed from nearly 190 in January 2020 to ~105 by the end of April. That’s a big drop!
The 1 on the chart illustrates where SMI wrote our first article explaining why we thought commodities represented a compelling long-term opportunity. The 2 is where we formally added a commodities allocation to our Stock Upgrading strategy.
Points 3 and 4 show a "mistake" — our system briefly had us sell commodities at point 3 and buy them back again four months later at point 4. It’s easy to forget now, but that late-summer 2021 period was when the COVID Delta variant was causing another round of shutdowns and our system picked up that softness in the data. This blip actually illustrates a point I frequently make about our trend-following strategies though: they don’t let us stay wrong for long. Any strategy is going to have some number of false signals or bad moves. This chart shows that even when SMI gets a move "wrong," we don’t stay wrong for long because the data will show us the error and quickly get us back on the correct side of the longer-term trend.
In terms of our broader cycle discussion, picture in your mind the "sine wave" pattern superimposed on this CRB chart. The cycle curves down through COVID, turns up, gets the "Enter" at point 1 or 2 (it actually would have been much sooner had we had this commodities system in place already, but it wasn’t developed until later in 2020), then continues higher through the rest of the chart.
At some point, that chart will roll over at the top, and shortly after that, the system will tell us to Exit commodities. The beauty of this mechanical process is we don’t have to fret all along the way, trying to predict when that top/exit will come. We can simply wait for the data to tell us, knowing we’ll give a little profit back and then exit. With commodities roughly tripling since their April 2020 low, the temptation to bail out early would be strong without a mechanical process like this to give us confidence to stay in the trade.
That’s a good illustration of how our trend-following processes help us stay in trades — the "let our winners run" aspect.
A stark contrast to a predictive approach
Now let’s look at how these strategies help us avoid another big error — getting into new positions way too early.
I’m going to throw someone under the bus here, but I didn’t even read the article so it’s nothing personal! This headline from earlier today is just such a perfect example of this point that I can’t not use it.
This is a perfect example of what I often refer to as a "predictive" investing approach. Once you start thinking about it in those terms, you’ll realize that the vast majority of the investing headlines/articles/TV segments you see are based on this type of thinking.
This is classic contrarian, value investing. In essence, the idea here is "small-cap growth stocks are super cheap, therefore this is a great time to buy them."
Let’s break this down to better understand it.
First of all, I love cheap contrarian ideas too. Seriously — it’s my innate personality bias and I’ve had to learn to guard against it. It’s what led me initially to the commodities idea in the summer of 2020 — they were historically cheap by every measure. But notice what we didn’t do. We didn’t see that cheapness and immediately say, "Mark thinks commodities are cheap, so we’re adding them to Upgrading." Or, "Commodities are historically cheap, so buy them now!"
Instead, we wrote an article about them, while simultaneously working on a mechanical system that would give us confidence that we could identify when turning points in the commodities market were taking place. Once we had such a system that we were confident would provide us with reliable enter/exit signals, then we added them to Upgrading.
Back to the small-cap headline above. Is right now a good time to buy small-cap growth stocks? Maybe, but I doubt it. Valuation is a condition, not a catalyst. Things that are cheap often stay cheap, or worse, get even cheaper. If this market goes where I fear it might, you don’t want anything to do with small/growth stocks right now!
In contrast to trying to evaluate their cheapness, here’s a chart showing how SMI’s Stock Upgrading strategy has handled small-cap growth stocks using its mechanical process:
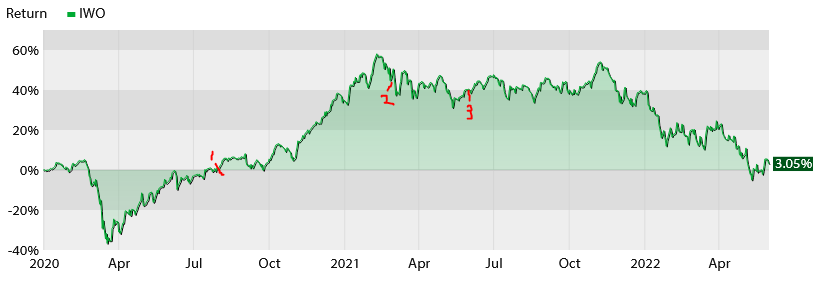
Upgrading bought small-cap growth stocks in August 2020 (point #1), sold two-thirds of them at the end of February 2021 (point #2), and exited the last of them at the end of May 2021 (point #3). Once again, mentally superimpose that "sine wave" curve onto this chart and you’ll see the pattern: buy shortly after the bottom, sell shortly after the top. Then stay out for as long as it takes until the longer-term trend turns — then and only then will we get back in.
So far, so good in terms of exiting small/growth stocks and staying far, far away ever since. At some point, I guarantee we’ll be buying small/growth stocks again! But why guess (predict) that now is the time to buy when we have a system that will eventually tell us when the trend has finally shifted back in their favor? If this turns into a bear market of the 2000-2002 or 2007-2009 variety, we wouldn’t expect the bottom to be in until mid-2023, by which time small-cap growth stocks could be down substantially more from here...all the while being "cheap" by whatever standard the author of that article was using.
Understanding the process bolsters your confidence to follow it
Hopefully, this series of articles gives you a deeper understanding of the SMI process and how it tends to play out over various time frames and asset classes. We know from experience that the better you understand the process and how it’s working, the more likely you are to follow it and the less likely you are to make counter-productive decisions at the worst possible times.