

One of the more interesting historical stock-market patterns is commonly referred to as “annual seasonality.” The main idea is that each year contains a six-month period that has been “favorable” for stocks (November through April) followed by a six-month period that’s generally “unfavorable” (May through October). Based on this, annual seasonality suggests selling stocks at the end of April and buying them again at the end of October.
The magnitude of the seasonality effect has been impressive. If you had started with $10,000 in 1930, and invested it in the S&P 500 only during the November-April favorable period each year, it would have grown to a whopping $4,777,100 by the end of 2017. On the other hand, if you had invested your $10,000 only during the May-October unfavorable period, it would have increased to just $147,645. During the favorable period, your money grew more than 32 times as much as it did during the unfavorable period! Stunning, right? (The SMI website contains information on a refinement to the annual seasonality strategy that has boosted returns significantly beyond even these levels. Search there for information regarding “MACD” to learn about this refinement.)
Well, yes and no. Over the past decade, we’ve noted the interaction of annual seasonality with another well-known market pattern: the four-year presidential election cycle. Stock market strength/weakness follows the four-year election cycle closely enough that, over time, clear trends have emerged. Keep in mind these are only averages and they don’t hold true every year. The 12 months following a presidential election — year one of a new term — has generally been the weakest of the four years for the stock market. Year two of the cycle has been a little better, but still below average. The pre-election year (year 3) has typically had the best stock-market performance. The election year itself (year 4) also has typically been a good one for stocks.
Putting this knowledge of the election cycle together with the annual seasonality strategy is where things get interesting. Several researchers have tackled this combination and found that the typical favorable and unfavorable periods associated with annual seasonality seem to perform differently based on the year of the presidential election cycle. Certain years in the cycle are fairly consistent in having better than average favorable periods, while others have worse than average unfavorable periods. This has important implications for those utilizing annual seasonality within their long-term investment plans.
Much of the research on this topic has focused on broad market indexes. But to gauge the impact on a more “SMI-like” portfolio, we analyzed how a portfolio split 50-50 between large- and small-company stocks would have performed over the eight distinct time frames (four favorable and four unfavorable periods) of the four-year election cycle.
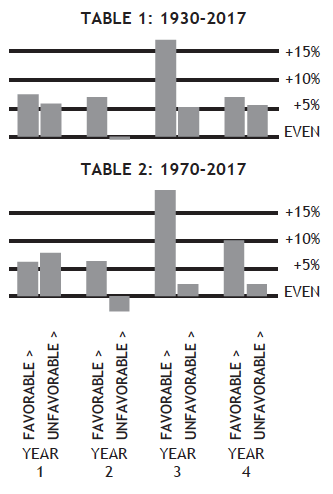
The results, shown in Table 1, are quite surprising. Rather than seeing a distinct separation between the favorable and unfavorable periods of each year as we expected, the combined data since 1930 tell a markedly different story. On average, six of the eight periods (favorable and unfavorable alike) showed gains within a narrow range of +5.2% to +7.5%. Only two periods vary significantly from that range, and as you can see, the unfavorable period of year two (corresponding to the six months leading up to the midterm elections) has been by far the weakest. This has been especially true for the past 45+ years as shown in Table 2.
The unfavorable periods of midterm election years have registered losses roughly half the time historically. Perhaps more troubling is the concentration of significant losses during these periods. In the 22 midterm election years (year two) since 1930, our hypothetical 50-50 portfolio lost more than 10% nine times during seasonality’s unfavorable period. That happened only seven times in the 66 other unfavorable periods combined.
On the positive side, the favorable period of year three (i.e., the six months following midterms beginning this coming November) has been especially good. In 11 of the 22 favorable periods in year three, a 50-50 portfolio gained more than +20%. Those kinds of gains occurred only 10 other times in the other 66 favorable periods combined. Given these extremes, it’s not difficult to see why these two periods around midterm elections stand out from the rest of the cycle, for better and worse.
Enter Dynamic Asset Allocation (DAA)
Recognizing that only one six-month period out of every four-year cycle produces an average loss takes the wind out of the annual seasonality sails. If seven out of eight periods are positive, there’s no point in exiting stocks, even during most of the “unfavorable” periods.
Alas, with the May-October period leading up to the U.S. midterm elections now upon us, we’re facing the one six-month period out of each four-year cycle when stock market performance has been much worse than usual. Which raises the question: “Would it be smart to lighten up on stocks during this one specific six-month period?”
Here’s where SMI’s Dynamic Asset Allocation (DAA) strategy can be helpful. DAA excels at dampening portfolio risk by providing specific timing signals telling us when to be invested in stocks and when not to. What annual seasonality attempts to do bluntly with twice-per-year signals, DAA does much more precisely with monthly analysis. Not surprisingly, DAA has provided much better signals of when to be invested in stocks and when to be out of them.
We have good DAA data dating back to the early 1970s, which allows us to compare DAA’s performance during the unfavorable periods of the last 11 midterm election years (1974-2014). That comparison is telling. If you had invested in the 50-50 mix of large- and small-company stocks we looked at earlier only during those 11 unfavorable periods (May 1-October 31 prior to each midterm election), you would have lost -34.3% overall. In contrast, if you had used DAA during those exact same periods and followed its normal signals, you would have gained +69.1%.
Of course, no one would have invested only during those worst-possible periods that came every fourth year. But it does show how damaging those periods have been over time, and that DAA has done a good job of basically erasing the idea of there even being set “unfavorable” periods.
If you decide to utilize Annual Seasonality
Given the choice, it’s clear that DAA provides a better risk-reducing timing mechanism than annual seasonality for avoiding market downturns. As a result, we think the best approach for readers inclined to alter their portfolio mix based on these types of factors is to incorporate DAA into a diversified portfolio instead (as described in this month’s cover article), and skip any annual seasonality adjustments entirely.
But we know there are readers who use annual seasonality within their 401(k) accounts or other places where DAA isn’t a realistic option. Those readers have the option of simply cutting back their stock exposure somewhat during this year’s unfavorable period. However, given the market’s powerful bullish trend over the past year, any seasonality refinements made to your portfolio should probably be relatively small rather than “all in” vs. “all out.” We’ve seen annual seasonality be painfully out of sync with the market at times, and with the market gaining +8.8% during last year’s unfavorable period, it’s certainly possible the market could defy this historical pattern again this year as well.
Here’s an example of what a measured change to the stock/bond allocation of a Just-the-Basics or Upgrading portfolio might look like. A person who would otherwise have a 60/40 stock/bond allocation might choose to lower that to 50/50 during the unfavorable summer period in midterm years (such as this year), then raise it to 70/30 during the unusually favorable winter period that follows. That would create an average allocation close to his or her ideal, optimized to correspond with the market’s long-term statistical pattern.
Along those same lines, paring back an aggressive Sector Rotation allocation during this unfavorable period is worth considering. While Sector Rotation has fared well during seasonally unfavorable periods overall (average gains of +11.3%), it has been a different story during unfavorable periods of midterm election years. During the seven midterm election year unfavorable periods for which we have data (1990-2014), Sector Rotation lost an average of -5.9%. That said, it’s only fair to point out that SR posted a huge gain during last year’s (2017) unfavorable period (+43.5%) and was up big during the last midterm election year unfavorable period in 2014 as well (+26.1%).
Conclusion
However you approach it, keep in mind these two important points.
Annual seasonality always has been an optional refinement to SMI’s strategies, never a core part of what we do. If you’re using DAA and Upgrading 2.0, as described in Higher Returns With Less Risk, Re-Examined, you likely have plenty of downside protection built into your portfolio. This seasonality discussion is more targeted to 401(k) users or index-fund investors who don’t already have bear-market protection in their portfolios.
The main objective of annual seasonality is to reduce risk, not to improve returns. The returns of a portfolio invested in stocks only during the favorable period (and in bonds the rest of the year) has produced results similar to a portfolio that was invested in stocks year-round. That’s because the long-term overall returns from bonds during the unfavorable periods haven’t been too different from the weak stock returns during the same periods. Rather, the advantage of seasonality is that you would have gotten roughly the same return while avoiding exposure to the stock market for six months of each year.
Reducing risk in this way during the coming unfavorable period in particular, may (seasonality doesn’t “work” every year) preserve capital in the short-run as well as offer peace of mind. For those interested in applying annual seasonality, watch the SMI website for new articles beginning each April and October, when we start tracking the official seasonality sell/buy signals.