

To the casual observer noting that the S&P 500 index is +8.1% year-to-date, last year's bear market seems like a thing of the past.
That probably isn't the right conclusion.
Bob Farrell was a Wall Street Legend who remains well known today for his "10 Rules" of investing — all of which are worth reading. Rule #7 in particular applies to today's market:
7. Markets are strongest when they are broad and weakest when they narrow to a handful of blue-chip names.
Translation: Breadth is important. A rally on narrow breadth indicates limited participation and the chances of failure are above average. The market cannot continue to rally with just a few large-caps (generals) leading the way. Small- and mid-caps (troops) must also be on board to give the rally credibility. A rally that lifts all boats indicates far-reaching strength and increases the chances of further gains.
The S&P 500 index's gains this year — and particularly since the March banking crisis — have been driven by an increasingly narrow cohort of the largest tech stocks. Absent those, the rest of the market has been flat to down for a while now.
Consider the following chart, which shows the S&P 500 index (+8.1% YTD), the same S&P 500 but equally weighted (+0.8% YTD), the Russell 2000 small-company index (-0.7% YTD), and the Russell MicroCap index of the smallest listed companies (-5.0% YTD).
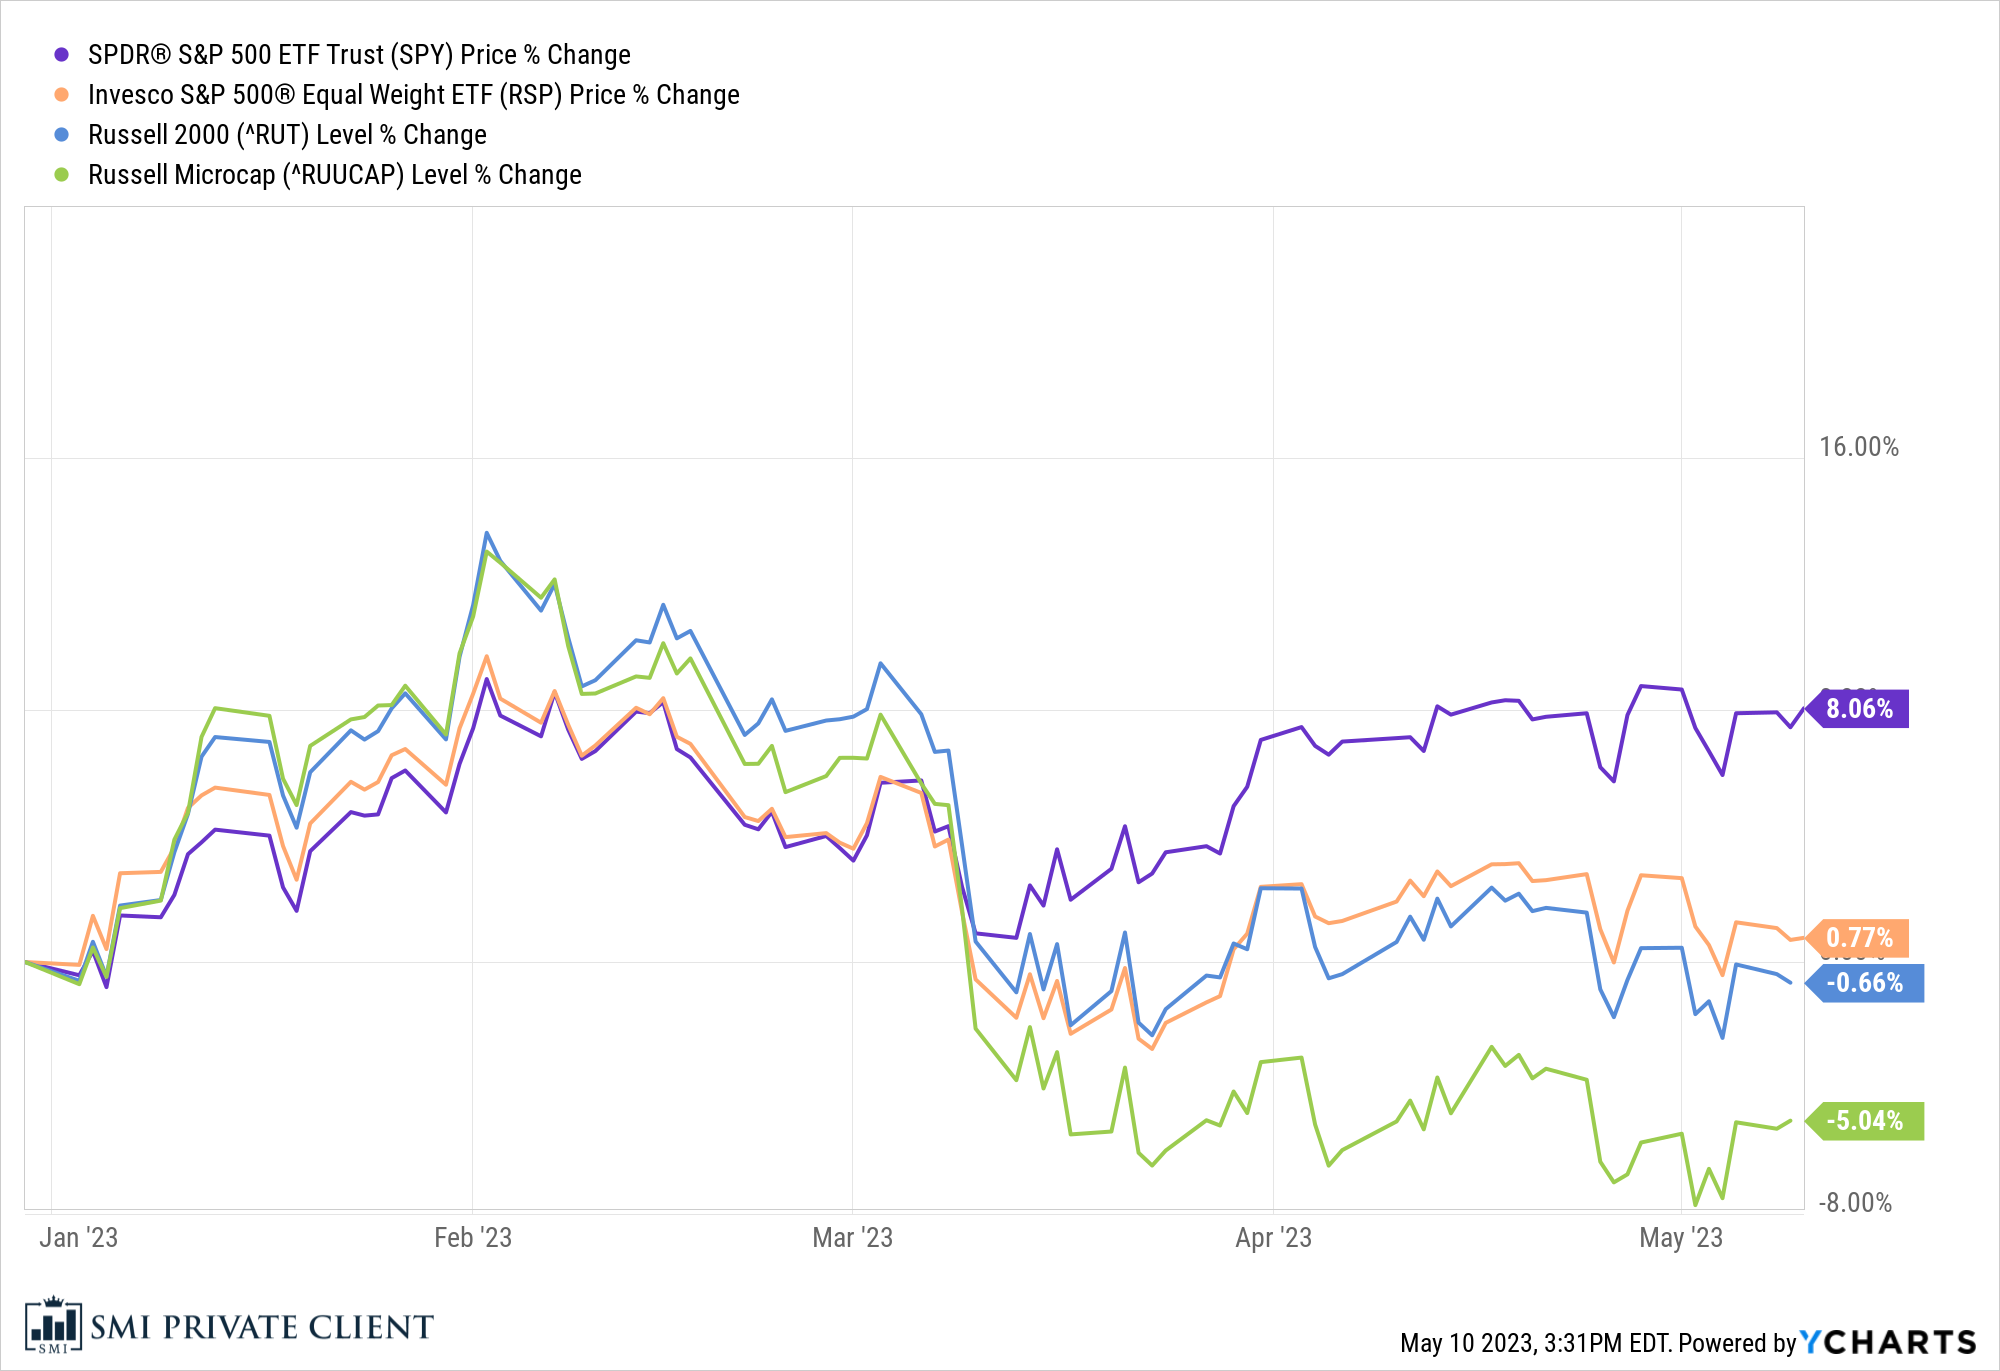
Note how all four groups started 2023 well, but since the March banking crisis, only the S&P 500 index has been able to muster any type of rebound. Obviously the smaller/smallest companies have struggled, but notice too how the S&P 500 equal weight has been fairly flat for the better part of the past two months as well. Same 500 stocks, but when they're equally weighted, the performance is about one-tenth that of the capitalization-weighted (normal) version of the S&P 500.
End of the banking crisis...or just the beginning?
One of the biggest divides between mega-cap companies and small ones is the way they obtain financing. The biggest companies issue bonds, whereas smaller businesses typically have to get financing from banks and other financial institutions. So it's not coincidental that the banking crisis marks a line in the sand on the performance chart above.
Two under-the-radar but important data sets were updated this week. The first is the SLOOS — Senior Loan Officer Opinion Survey. This is basically the measure of what lenders are doing and the latest update is chilling (though not unexpected).
Latest quarterly update for Fed’s Senior Loan Officer Opinion Survey #SLOOS shows net -22.8% of respondents reporting willingness to make consumer loans pic.twitter.com/4RFy4M3LXP
— Liz Ann Sonders (@LizAnnSonders) May 9, 2023
We don't have to dig too hard into this one to see that the willingness of banks to lend is drying up at a pace comparable only to the Great Financial Crisis in 2008/9 and COVID in 2020.
The second is a little more surprising — it indicates that demand for commercial loans is also shriveling. Generally a bad sign, and again the only comps are periods you don't want to compare with — nasty bear market recessions in 2001/2 and 2008/9.
SLOOS indicates demand for commercial loans has completely tanked. Credit crunch is really starting to hit and we haven't seen the effects. Yet. pic.twitter.com/e8wgxXD9tD
— Jeffrey P. Snider (@JeffSnider_AIP) May 9, 2023
The other data series showing things are a lot tougher than the S&P 500 is indicating is the NFIB small business optimism index. Again, the picture says it all:
Micro caps showed us the way … @NFIB optimism hits another low. https://t.co/VF4cktxD9z pic.twitter.com/EV5b17nQU2
— Kantro (@MichaelKantro) May 9, 2023
Once more, the only comparable is the GFC in 2008. Perhaps the most striking thing about this one is small businesses are essentially saying they are more pessimistic today than they were in 2020 when the government was literally shutting them down.
The second chart of micro-cap stocks hitting fresh 2.5-year lows just reinforces the point from earlier — while the S&P 500 index looks pretty good this year, it's a deceptively narrow group of stocks doing the heavy lifting. Keith McCullough of Hedgeye has described this market as the Titanic sinking — when it's sticking straight up before it sinks, everyone runs to that end of the boat and stays dry. But it's herding into a narrowing set of stocks before they eventually all go down.
We certainly can't say for sure that will be the outcome this time around. But Bob Farrell warned decades ago of this very phenomenon. Cycles repeat, which is why patterns like the "Nifty Fifty" from the early 1970s look a lot like the tech bubble of the late 1990s, which look a lot like the mega-tech stocks today.