

SMI members enjoyed strong performance during the first half of 2024. Several of our model portfolios, including Just-the-Basics, Stock Upgrading, and Dynamic Asset Allocation, set new all-time highs during June as the year’s mid-point approached.
Yes, the bull market in U.S. stocks played a large part in that! But it’s been more challenging than it might appear to generate strong returns without accepting dangerous levels of risk.
The dramatic outperformance of the largest tech stocks (the “Magnificent Seven” or “Mag 7”) has been a theme we’ve noted multiple times over the past 18 months. The concentration of market returns into a narrow handful of stocks is more extreme than ever.
Because the most prominent indexes (such as the S&P 500 Index) are weighted by market capitalization (companies worth more, count more), this concentration of returns significantly distorts investor perception regarding how “the market” is performing. The big stocks get more valuable and investors perceive the market is strong, when relatively few stocks have actually been participating in that upside.
The chart below shows this dynamic vividly. The black line shows the total return of the S&P 500 Index through mid-year — a gaudy +15.3%! The green line shows the return of the same index, but equally weighted, so the impact of the Mag 7 stocks is no greater than any of the other 493 stocks. This adjustment makes an enormous difference, cutting the S&P 500 equal weight total return to just +5.1%. Clearly, the other 493 stocks in the index, as a group, haven’t fared nearly as well as the leaders.
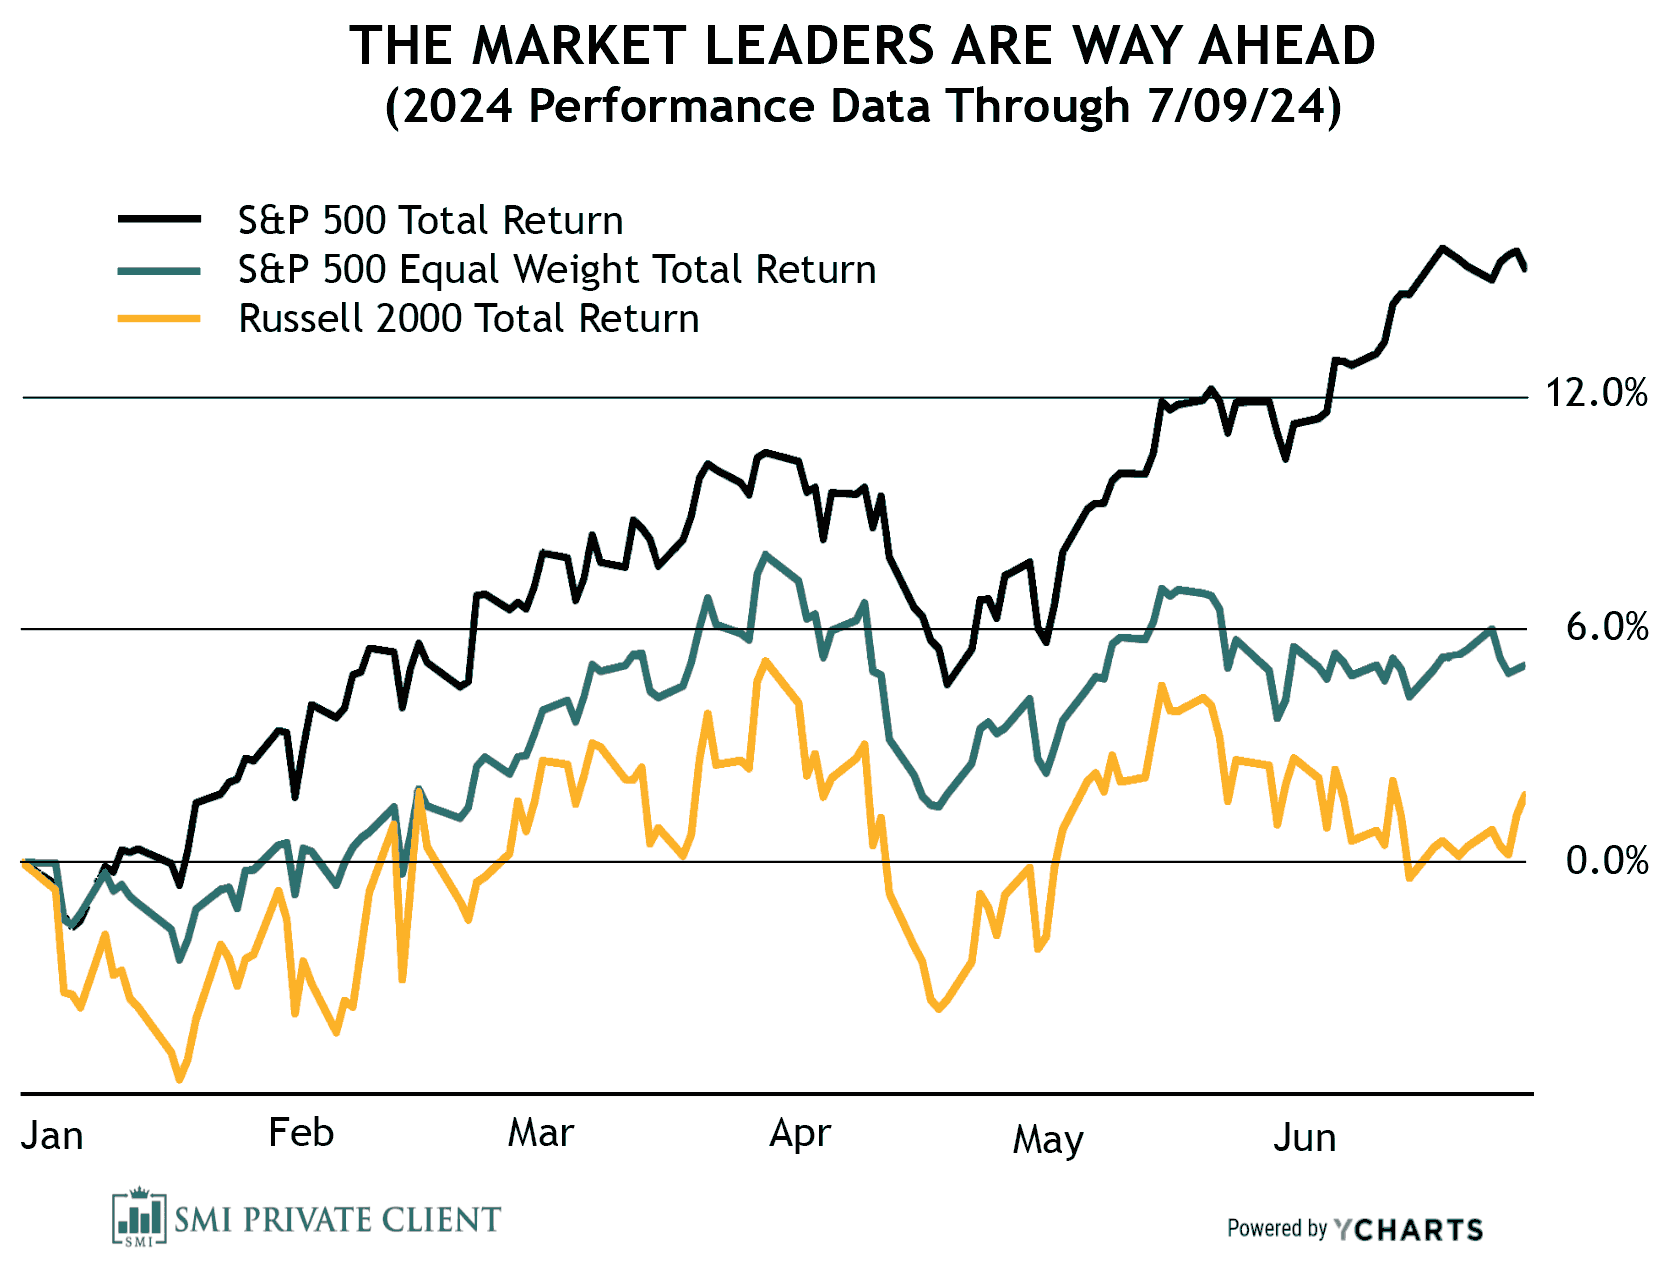
Finally, the yellow line shows the total return of the small-company-focused Russell 2000 Index, which was barely positive during the first half of the year at +1.7%.
In addition to the obvious gulf between the performance of the largest stocks and the rest of the market, there’s another message in this chart. Note how both the green and yellow lines peaked in March and hadn’t yet recovered to those highs. Investors have eyes only for the black line — the S&P 500 Index — which remains in a strong uptrend. However, the message of the green and yellow lines is that most U.S. stocks struggled to regain the positive momentum of the year’s first quarter. (Note: A strong July surge in smaller-company stocks pushed both lines above their March highs since the data in this mid-year report.)
The takeaway: The U.S. stock market wasn’t as strong as many investors assume based on the S&P 500 Index’s first-half performance. The S&P 500 Index has been a challenging benchmark to beat without concentrating a portfolio in the handful of tech stocks driving the index’s returns.
SMI’s 2024 returns still compare favorably, even though our diversification extends well beyond the top tech stocks. Here’s a quick review of each strategy’s first-half performance.
Just-the-Basics (JtB) & Stock Upgrading
Given the chart shown here, it’s no surprise that the bulk of JtB’s first-half returns came from its S&P 500 stock allocation. Combining that strong return with positive but lower returns for smaller companies and foreign stocks, an all-stock JtB portfolio gained +8.5% during the year’s first half.
Stock Upgrading performed much better, gaining +14.9%. This was superior to the Wilshire 5000’s gain of +13.6%, despite Stock Upgrading allocating 30% to small companies and another 10% to commodities. Commodities’ relatively low return (+3.6%) kept Stock Upgrading from outperforming the S&P 500 Index, but it’s impressive Stock Upgrading was even that close given the broader market dynamics.
Bond Upgrading
Bonds continue to struggle in the current sticky inflation/higher interest rate environment that has caused bond investors so much pain in recent years. Bond yields dropped in June, which helped the bond index open up a slim first-half lead over Bond Upgrading, -0.7% to -1.4%.
Both returns are unimpressive, which is why SMI allocates less than many advisors/models to bonds in the first place. Instead of a static 60/40 (or similar) allocation, SMI utilizes dynamic approaches like DAA to help manage overall portfolio risk while providing greater upside potential via alternative allocations such as gold and commodities. For example, an SMI member using a form of the 50-40-10 portfolio discussed at the end of this article would have had only 16% allocated to bonds during the first half of 2024 (40% of their 40% Upgrading allocation). That’s less than half the bond allocation of a traditional 60/40 portfolio, but it’s been a winning combination for SMI members so far in 2024.
Dynamic Asset Allocation (DAA)
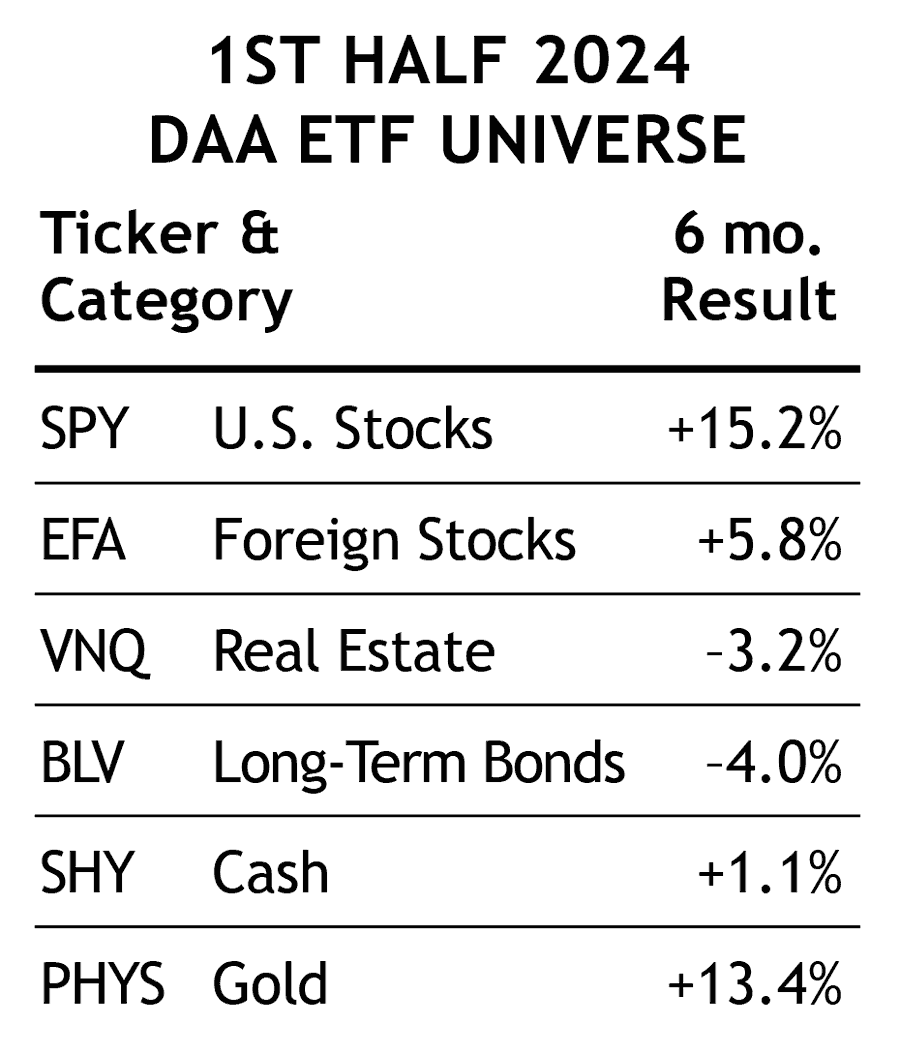
DAA had a solid first half of the year, gaining +9.0%. This performance was driven by the strong gains in U.S. Stocks (SPY, +15.2%) and Gold (PHYS, +13.4%). International Stocks (EFA, +5.8%) also contributed positive returns. As is often the case, avoiding the worst asset classes was a big part of DAA’s success, as Real Estate (VNQ, -3.2%) and Long-term Bonds (BLV, -4.0%) lost ground during the first half.
DAA’s +9.0% gain may not look impressive relative to the S&P 500’s first-half gain, but that’s not a realistic benchmark, especially during a bull market. A blended 60% stock (Wilshire 5000 Index) and 40% bond (Bloomberg U.S. Aggregate Index) gained +7.9% during the first half, a full percentage point less than DAA.
Sector Rotation (SR)
SR rebounded from a poor first quarter (-3.75%) with a strong second quarter (+14.5%), enabling it to post a solid +10.2% gain overall for the year’s first half. SR’s second-quarter success was due to its pivot into semiconductor stocks, which continued to benefit from investors’ excitement regarding AI (artificial intelligence).
50/40/10 (with 60/40 stock-bond Upgrading)
This portfolio refers to the specific blend of SMI strategies — 50% DAA, 40% Upgrading, 10% Sector Rotation — discussed in our article, Higher Returns With Less Risk, Re-Examined. In 2024, we started reporting this portfolio using a 60/40 split between Stock & Bond Upgrading within the 40% Upgrading allocation. This reporting change reflects how most SMI investors utilize such a “whole portfolio” blend. Such a blend is a prime example of the type of diversified portfolio we encourage most SMI readers to consider. (Blending strategies adds complexity. Some members may prefer SMI Private Client's automated approach.)
This version of a 50/40/10 portfolio gained +8.9% during the first half of 2024. That’s a full percentage point better than a generic 60/40 portfolio (+7.9%, see DAA section above) and half a percent better than a 60/40 Stock-Bond Upgrading blend (+8.4%). Earning better returns than the stock/bond-only portfolios most investors utilize while also gaining considerably broader diversification via SMI’s gold and commodities allocations is a great combination.
Conclusion
Seeing bonds continue to struggle during the first half of 2024, while stock returns increasingly accrued to a narrow set of the largest stocks, reinforces our belief that we need to be vigilant in our effort to creatively diversify while hunting for superior returns. Having walked with investors through the dot-com bubble and crash 25 years ago, we remember how quickly the tables can turn on a small group of seemingly invincible tech companies. As we’ve written about several times, we think there’s a good chance the current inflation/interest rate dynamic will persist for some time, meaning there may not be any significant relief for bond owners in the years ahead (see our January 2024 cover article, Uncomfortable Regime Shifts).
To that end, we continue to work hard to develop attractive alternatives to boost returns while protecting against risk. We’re excited about the potential of the investing model discussed in Full-Cycle Trend: Upgrading for Individual Stocks, as well as the accompanying new ETF announced here.
See this month’s Fund Upgrading Update for ideas on incorporating these new tools into a well-diversified portfolio.