

Even after the dreadful losses of 2008 — and despite numerous past recessions and even a Great Depression — the remarkably resilient U.S. stock market has returned, on average, +11.3% per year since the mid-1920s. That’s for a portfolio of one-half large-company stocks and one-half small-company stocks (based on data from Ibbotson Associates, an industry leader in compiling market statistics). This assumes all dividends were reinvested and ignores the sad fact that in real life Uncle Sam may confiscate a hefty portion of your gains.
Of course, knowing the market’s average return has been +11.3% annually doesn’t tell you what the return will be this year. And such an average obscures some wild rides along the way — such as 12-month periods where losses were as horrifying as -69% and gains were as breathtaking as 240% (those two extremes occurred back-to-back in 1932-1933). In fact, only about 5% of the time over the past 90+ years have stocks actually returned close to +11.3% (give or take 1%) in a 12-month period.
But what the market’s long-term average return makes clear is that time is on the side of the long-term investor. The longer you’re willing to keep your money in the market, the greater the likelihood of success.
According to the Ibboston data, if you had randomly picked any 12-month period to own stocks (from 1926 through 2022), you would have had a 74% chance of making money. How much money? Study the historical evidence in the table below. Column one shows you would have had about a 39% probability of making 20% or more, a 20% chance of making 10%-20%, and a 15% chance of earning 1%-10%.
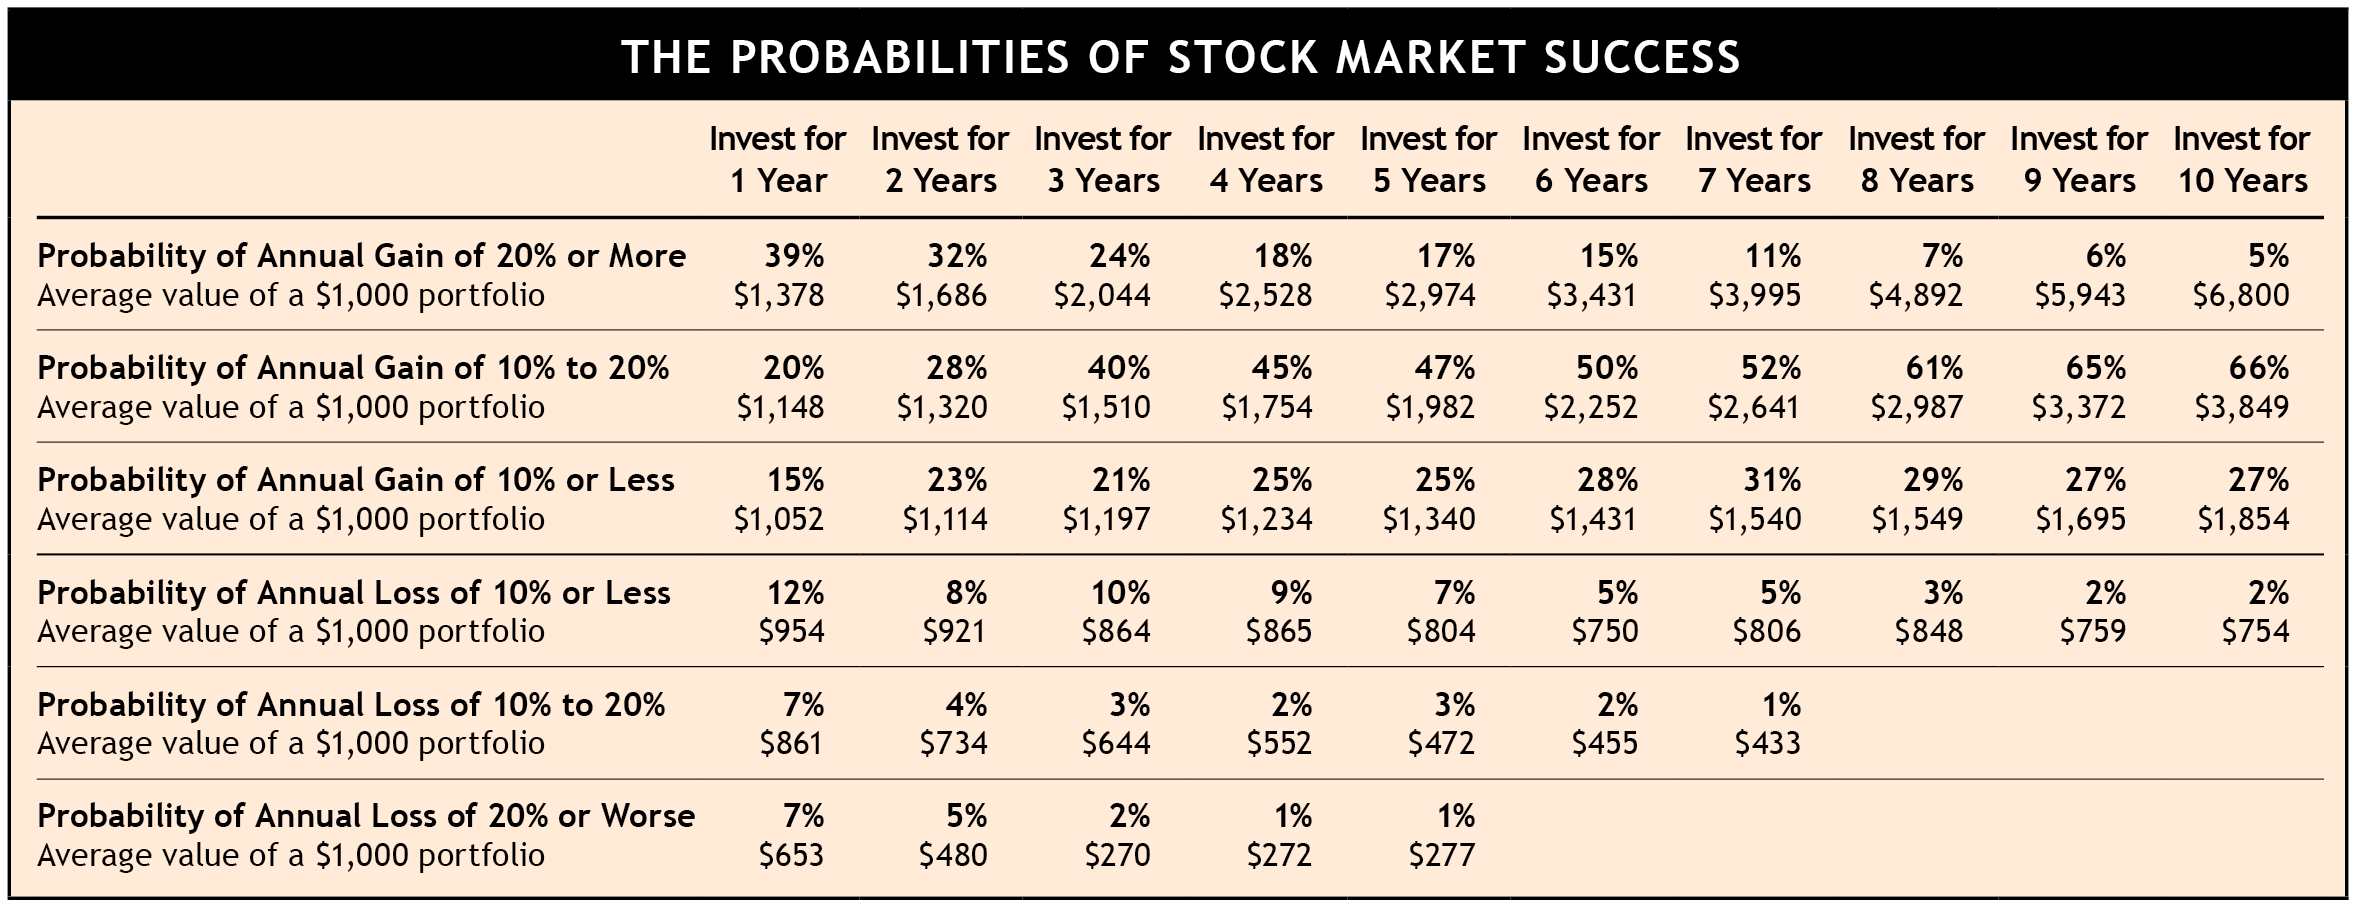
Click table to enlarge
Note: The table is based on “rolling” periods. After looking at results from holding periods that began on Jan. 1, the calendar was “rolled” to the next month to see what happened for the holding period that began on
Feb. 1 — and so on. This gives a better understanding of the extremes you might expect.
Now, notice that for five-year holding periods, losses occurred only 11% of the time. In other words, if you held your stocks for at least five years, you increased the likelihood of making money to 89%. Also note that as the holding period lengthens, the very large gains and losses gradually disappear as the market moves closer to its long-term historical average. Most importantly, notice that by the time you reach holding periods of 8-to-10 years, the likelihood of loss falls to only 2%-3%.
The importance of diversification is reinforced by this study. SMI has noted before that the S&P 500 Index, which primarily measures the performance of large-company stocks, was a negative -1.4% for the 10-year period ending in 2008. But when we change the portfolio to 50% small companies, their stronger performance during that decade flips the overall return to a gain of +2.7%. A similar improvement was true when adding small companies for the 10 years ending 2009, going from -0.9% to +2.9%.
For those concerned we could be in another period of sustained market weakness similar to the 2000s, it’s worth noting that our Stock Upgrading, DAA, and Sector Rotation strategies would have recorded profits for the 1999-2008 decade with annualized gains of +6.1%, +11.9%, and +21.3% respectively. All three turned in healthy gains for the 10 years ending in 2009 as well.
The volatility of shorter-term investing periods is why SMI recommends a five-year time frame as a minimum for investing in the stock market. Although one can’t guarantee a positive return from stock investing over the next five or 10 years, it’s reassuring that even the worst recent decade (1999-2008) ended with modest gains for diversified investors. The odds of success are excellent for long-term investors.