
War, inflation, plague. The events of the past few years seemed tailor-made to send the gold price to the moon. Yet the type of explosive rally long envisioned by gold enthusiasts has proven elusive. Is such a move still ahead? And if so, why hasn’t it happened already?
We offer our best interpretation of the factors influencing gold, as well as how various economic outcomes might influence its price. Most importantly, we review how SMI suggests members interact with this volatile asset class.
When gold last graced the cover of SMI in June 2020, it seemed the sky was the limit for its potential price. The COVID pandemic had shut down much of the global economy, leading to unprecedented fiscal and monetary responses. We didn’t know at the time exactly what impact those measures would have on inflation, but many suspected an inflationary pulse might soon follow. Even less predictable was that a major war in Europe would break out within two years! The outlook for gold was already bright, but had we known what was about to unfold, it would have seemed downright blinding.
Yet, surprisingly, most of gold’s move higher was already over by the summer of 2020. Sure, gold would spike from roughly $1,700/oz. in June 2020 to a new all-time high of ~$2,070 in August. But by March 2021, it had round-tripped back down to $1,700. And while the March 2022 Ukraine invasion would briefly spike gold back above $1,900/oz., that too was short-lived, as gold would fall all the way to $1,628 by November 2022. This despite U.S. inflation hitting a 40-year high of 9.1% that June!
How is it possible that in the face of massive deficit spending, debasement of the dollar, inflation, war, and locusts (okay, I made that last one up), the gold price could remain so restrained? More importantly, if this combination of factors couldn’t combine to pump the gold price significantly higher, is it even worth owning gold anymore? Isn’t the ~15% loss in dollar purchasing power over the last three years exactly the type of thing we’ve always been told gold will protect against?
Gold isn’t just “one thing”
Part of the frustration gold inflicts on investors is due to the fact that it doesn’t act according to just one variable. If it was just an inflation play, we could expect its price to have peaked with inflation in the summer of 2022. Or if it was just a hedge against geopolitical conflict and war, we would expect another set of behaviors. Likewise, relationships to currency debasement, deficit spending, and other single variables tend to fall short when trying to explain fluctuations in gold’s price. Gold reacts to all of these variables, but is governed absolutely by none of them. Thus the frustration for investors who try to use gold as a hedge against any of these specific outcomes.
It’s also fair to point out that while gold’s moves can often be perplexing in the moment, they often make more sense in hindsight. For example, while many investors looked forward to an explosive move higher after the COVID stimulus measures started to run full-tilt, looking back with the benefit of hindsight we can see that gold did have a dramatic move higher, but most of it came before the COVID shock hit markets. Gold soared +42% in the 18 months before COVID, fell sharply initially, then rallied another +33% from March to August 2020. Altogether, gold soared from $1,178 in August 2018 to $2,067 in August 2020 — a +75% advance in just two years. It’s just most of that move happened before investors were looking for it.
This type of unpredictable volatility isn’t unusual for gold. Even during the huge gold bull market of the 1970s, there were big price drops along the way. SMI has long been aware of — and had to work around — this extreme volatility in gold and precious metals. Over 20 years ago, we ultimately excluded precious metals funds from our initial Sector Rotation research because their extreme volatility kept scrambling our testing results!
Enter Dynamic Asset Allocation
We’ve pointed out several factors that influence gold, but ultimately prove frustrating when trying to use those factors to model or predict gold’s price. So this is a good time to review what does work in terms of steering our gold investing.
To be clear, there is a case for owning a relatively small allocation of physical gold. Because the cost and hassle of transacting in physical metals is so high, we tend to encourage this to be more of a “forever allocation” — the type of thing you might pass on to heirs in your old age or in your estate. It’s impractical for most people to buy and sell physical gold with any frequency, nor do most people want to incur the risk involved with storing large sums of gold or other precious metals locally. So while SMI has written about the best ways to buy/sell/store gold, this is normally intended for small allocations of perhaps 5% or less of a person’s total portfolio. (For a detailed explanation of ways one can invest in physical and other forms of gold and precious metals, see the June 2020 article, SMI’s Winning Approach to Owning Gold.)
However, there are times when it is opportune to have a larger allocation to gold while maintaining the flexibility to subsequently reduce those holdings when conditions warrant. In simple English, sometimes you want to own more gold, other times less.
This conundrum was largely solved with the creation of Dynamic Asset Allocation (DAA), which debuted in 2013 after a long period of research. Ironically, DAA’s origins stem from the work of a “perma-gold-bull” who advocated a consistent 25% position in gold. While a large permanent gold allocation wasn’t appealing, that research process opened our eyes to the value of tactically allocating to gold during certain portions of the economic/market cycle, as it is a great risk diversifier and safe haven asset. Once we developed the approach of dynamically shifting between asset classes, we were finally able to settle the question of how to optimally interact with gold.
It’s crucial to understand that gold is extremely cyclical and volatile. Though normally thought of as a conservative investment, gold is prone to huge spikes and collapses, as well as long periods of time when the price doesn’t move much at all.
So we were pleased when DAA provided us with a disciplined approach that enabled us to safely interact with gold on more than a “hold a small permanent allocation” basis. DAA reliably provided historical signals to buy gold when conditions dictated it was wise to do so, but the real key was DAA’s uncompromising selling discipline that got us completely out of gold when it faltered.
DAA continues to provide valuable gold buy/sell signals
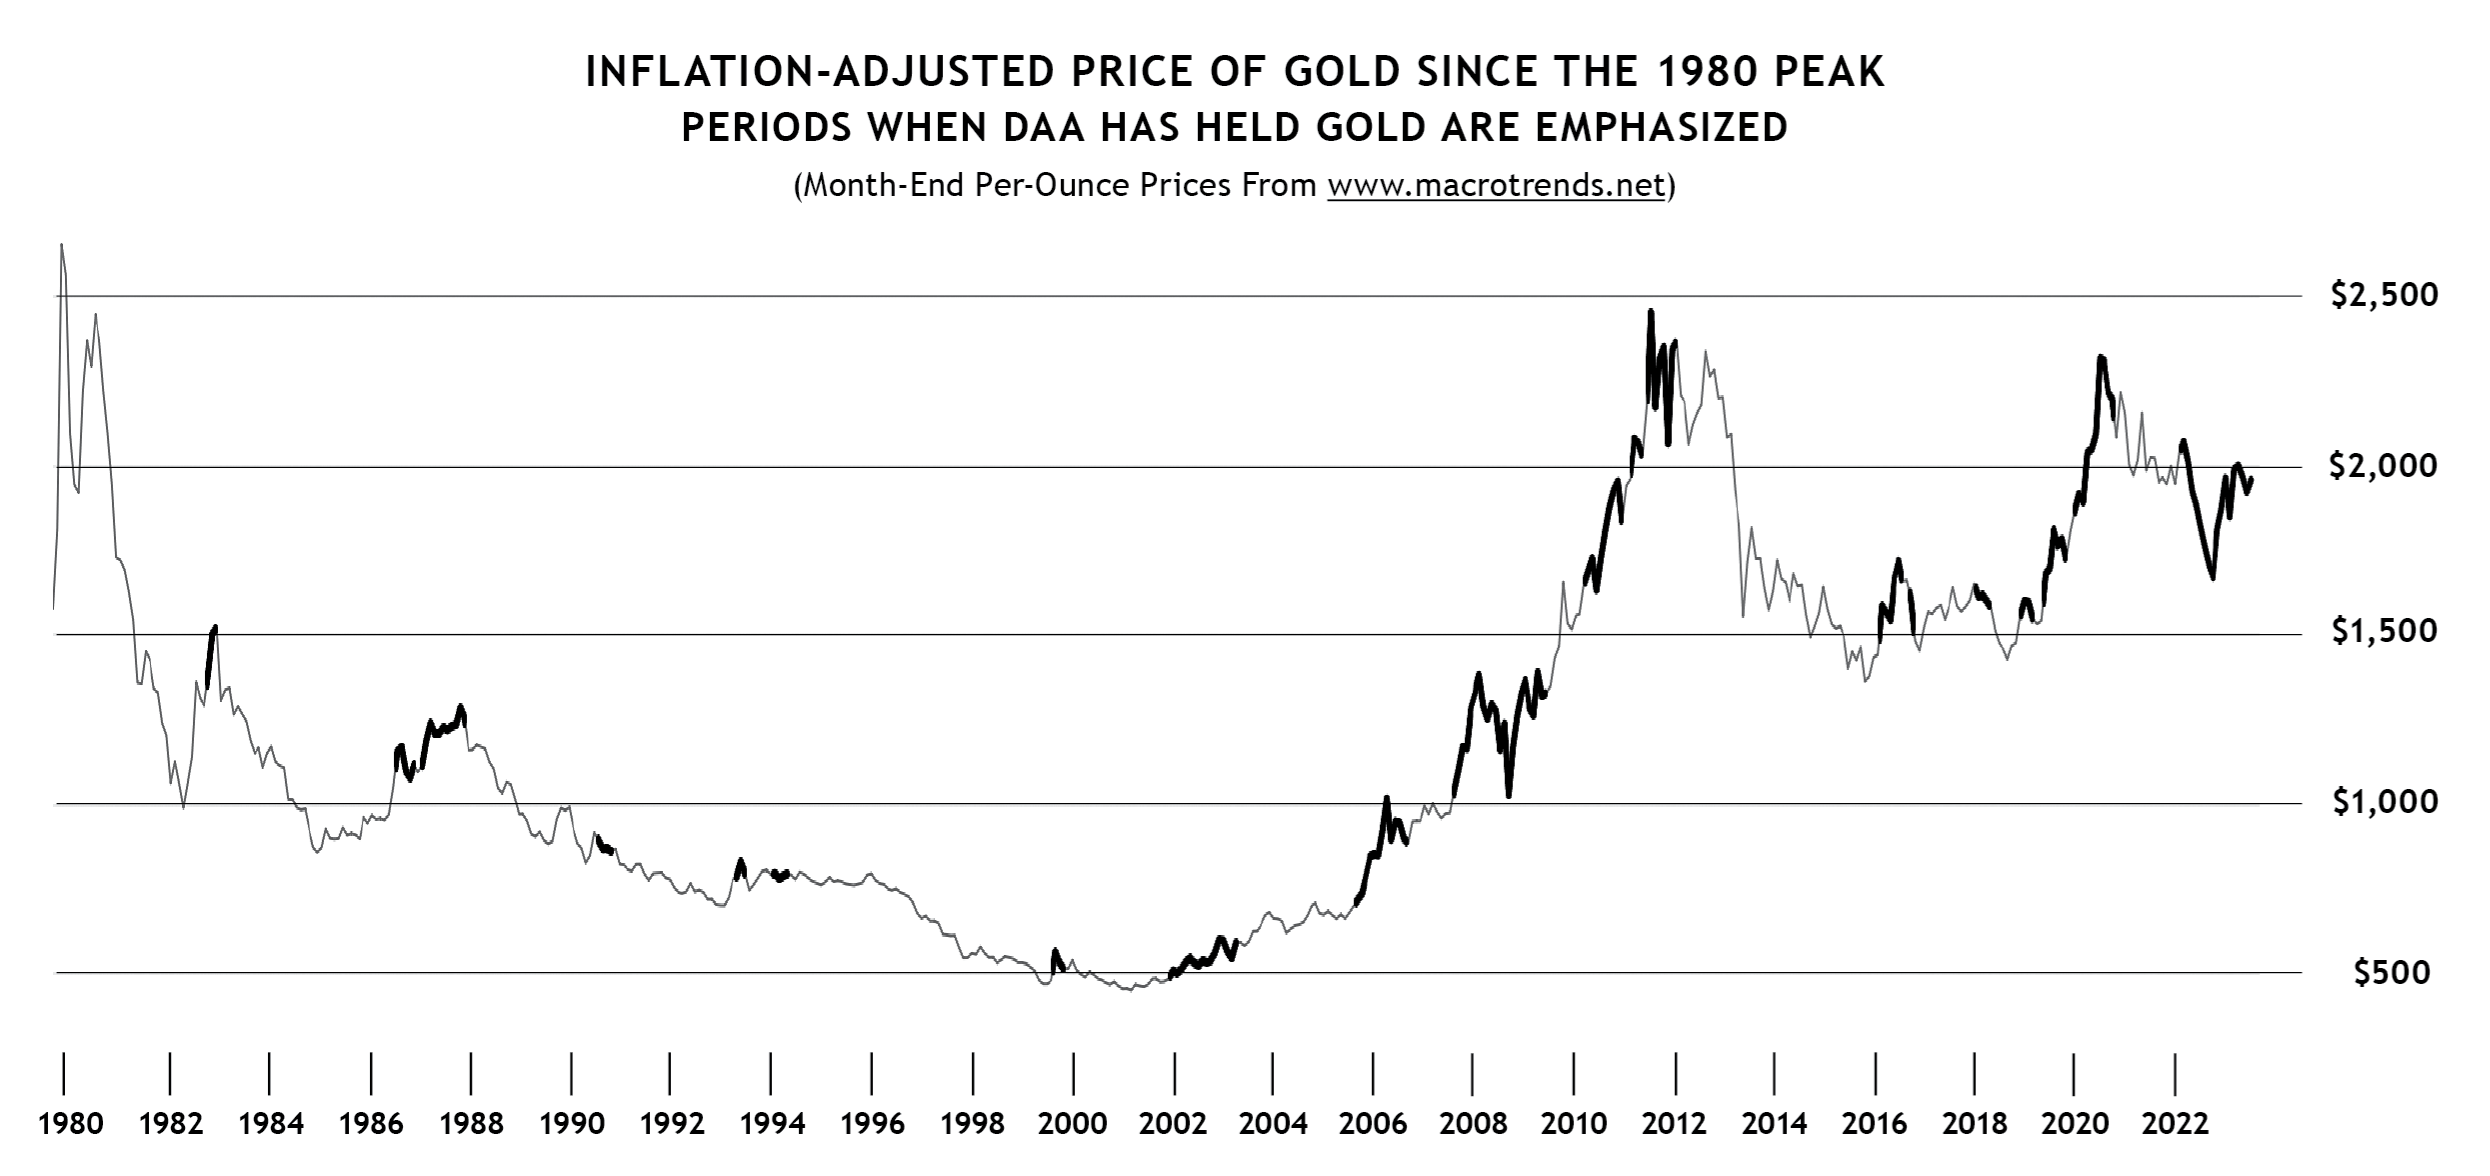
The graph blelow illustrates how effectively DAA’s mechanical signals would have navigated the gold market over the past 40 years. It shows the monthly price action of gold going back to its peak in January 1980, but is adjusted for inflation, which means that the older prices are shown in today’s dollars. In other words, when gold peaked in 1980, the actual (nominal) price was $850/oz. But after adjusting that amount for the inflation that has occurred since then, our graph below shows that price at over $2,500/oz.
This is a crucial adjustment, as it makes clear that even after the huge 11-year bull market in gold from 2000-2011, gold’s price still didn’t quite recover to its previous high in “real” terms. Nor was last year’s peak around $2,070 truly a new all-time high after adjusting for inflation. Today’s gold price, adjusted for inflation, is still considerably below the 2011 peak and 1980’s all-time high. That’s an important point to be clear on.
The dark bolding denotes each period when DAA would have been invested in gold for at least three consecutive months. (There were times when DAA called for gold, only to sell it a month or two later. The long-term nature of the chart makes those blips too short to see clearly.)
Click to enlarge
Observing DAA’s interaction with gold this way is instructive. The most important point this illustrates is that DAA would have successfully steered us clear of every significant decline in gold’s price over the past 40 years. (The lone exception — the 2008 financial crisis — was a period when other asset classes were falling even more than gold.) Given DAA’s mantra of “winning by not losing,” as well as the severity of some of gold’s declines, this ability to steer around cyclical price declines in gold is crucial.
Less obvious is that DAA’s interaction with gold when gold prices have been rising has also been quite good. There were numerous times when DAA was invested in gold and the gold price was increasing. But what about the other places where gold was rising but DAA wasn’t invested in it?
It’s important to understand that DAA is a relative-value system rather than an absolute-value system. That means DAA measures the value of each asset class in relation to the value of every other asset class, not independently. So DAA isn’t measuring “is now a good time to be invested in gold or not” in a vacuum. Rather, it is measuring whether, in relation to the other five asset classes in DAA, gold is among the best asset classes to invest in right now.
The graph above provides excellent examples of this point. Perhaps the most stark is the period from July 2003-September 2005. DAA was out of gold for almost all of this 27-month period, which seems odd because gold was clearly in a strong, lasting uptrend. In fact, gold rose +35.5% during that 27-month stretch. But here’s where the relative value aspect comes in — that 27-month period was also very strong for the other asset classes. DAA rose +42.3% during that span — even better than gold’s performance. This dynamic has also worked in reverse at times, as in 2022, when DAA had us temporarily absorb a -15% decline in gold — a period when both stocks and bonds were down even more.
Ultimately, the graph vividly illustrates that DAA’s signals would have done a solid job navigating the treacherous waters of the gold market over an extended period of time. It would have avoided owning gold during most of its extended declines (1980-2000, 2012-2016), while owning it during the bulk of its rapid advances (2009-2012, 2018-2020). Rather than owning gold on a continuous basis, including long stretches when it was in price decline, the historical record indicates DAA would have provided us with a better tactical approach.
Own physical forever, supplement with DAA tactically
Not surprisingly, then, we think SMI members are wise to rely on DAA’s signals for the bulk of their precious-metals investing. An SMI member’s exposure to gold will vary, based both on how much of their total portfolio is allocated to DAA, as well as whether DAA is invested in gold at the moment. For example, an SMI member with half their portfolio allocated to DAA would see their gold allocation range from as little as 0% (no gold recommended in DAA) to as much as 16-17% (one-third of DAA, which is 50% of the total portfolio).
Outlook for gold
Earlier we discussed several factors that investors often expect to drive the gold price, but that have historically only been weakly correlated. But there is one simple factor that has a strong historical correlation: interest rates.
This probably shouldn’t be a surprise, given that interest rates are interconnected with many of these other variables, like inflation, currency debasement, and so on. But it’s helpful to be able to distill this down to a single variable, as it provides insight as to what we might expect from various potential economic paths forward.
It’s reasonable to simply think about gold price movements in terms of interest rates rising or falling. When interest rates rise, gold’s price normally declines. This makes a lot of intuitive sense. Gold doesn’t pay a yield, so when the yield on other “safe” investments rises, they become relatively more attractive and gold falls. Also, yields typically rise during stronger economic periods when there are more attractive investment options, while they normally fall during periods of economic weakness when there are fewer good alternatives to gold.
That said, the “real yield” has the best long-term correlation to the gold price, The long-term real yield is the difference between the current yield of the 10-year Treasury Bond (3.86%) and the 10-Year Breakeven Inflation Rate published by the Fed (i.e., the expected long-term inflation rate, currently 2.25%). Thus, as of this writing, the current 10-year real yield is 1.61% (3.86%-2.25%).
The graph below shows the relationship between the gold price and the level of real yields over the past five years. (The chart can be a little confusing because the real yield line is inverted, which means a falling real yield line indicates a rising yield — see yield values on the right of the graph).
One mystery stands out from the chart, however. The long-term real yield has tracked the price of gold fairly reliably — until recently. Notice how the two lines normally move closely together but have diverged significantly over the past year. Last November, when rates peaked and started to decline, gold vaulted higher. Today’s level of real yields would normally correspond to a sharply lower gold price.

Click to enlarge
Why has gold held up so well in spite of rising rates?
There are a few possible explanations for why gold hasn’t declined more as yields have risen.
The first inflation spike in many years is changing this relationship. This is certainly reasonable, as many economic relationships are having to be recalibrated for higher inflation. But it’s not the only possible explanation.
CPI inflation may be a poor measure, or distrust of its accuracy could be influencing this relationship. Going back to our explanation of real yields, if investors actually expect long-term inflation to be higher — say, 3.25% rather than 2.25% — the gap in the chart would shrink dramatically as the real yield would be 0.61% rather than 1.61%. In that event, the real yield line would be somewhat more closely aligned with the current price of gold.
Shifts in the global financial system are lending more support than usual to the gold price. This is almost certainly part of the equation, though how much is debatable. It’s no secret that many countries want to be less reliant on the U.S. Dollar and U.S. Treasuries for their trade and foreign reserves. This long-simmering resentment shifted into overdrive when the U.S. and its allies refused Russia access to their global reserves following the Ukraine invasion. As a result, a number of countries have begun exploring ways to conduct more trade outside of the dollar (which would in turn reduce their need to hold as many dollars in reserves in the form of U.S. Treasuries). While this involves many challenges, the BRICS group (Brazil, Russia, India, China, South Africa) has attracted significant interest from other nations with their goal of somehow creating a dollar alternative backed to some degree by gold.
There are a number of reasons why this is going to be difficult to pull off. But one immediate impact of the Russia sanctions and reserve seizure has been that central banks around the world have dramatically increased their purchases of gold. It’s hard to say how much of this is defensive and how much is simply a response to U.S. Treasuries being less attractive given the U.S. is projecting massive deficits extending far into the future. All that future Treasury issuance isn’t likely to be good for future bond prices, making gold look relatively more attractive for a portion of their national reserves.
Sizing up the likely path forward for gold
Gold appears to have a bright future. As explained above, foreign interest in a dollar alternative has never been higher. The same could be said domestically, as the strong continuing interest in Bitcoin demonstrates. And for good reason: the U.S. current deficits of 6-8% of GDP would likely explode to 10% or more in a recession. Interest expense and entitlement spending are ramping up rapidly. Events such as the weaponization of the dollar against Russia and Canada’s freezing of bank accounts for supporters of the trucker convoy have nations and individuals looking around for alternatives. No surprise that many view gold — the best historical insurance against financial system problems — as a possible alternative to holding dollars.
Setting those longer-term issues aside, the medium-term outlook appears positive for gold as well. The playbook of 2008 and 2020 is well established at this point. If the economy runs into trouble over the next year or two, we can expect the government and Fed to engage in more stimulus and easing, further debasing the purchasing power of the currency and creating similar conditions that have caused past gold spikes. Even if a recession is somehow avoided, longer-term the government is still going to have to finance massive deficits, which some observers think will be impossible without the Fed’s assistance. Whether through a return to Quantitative Easing, yield curve control, or a new set of tricks, when the Fed intervenes to lower rates, it tends to benefit the gold price.
But while the medium- and long-term outlooks appear favorable for gold, there is a short-term warning. When investors panic, the first move for gold is usually down. Gold is very liquid and when investors have to sell what they can in a dash for cash, precious metals are often the proverbial baby thrown out with the bath water.
There’s no guarantee we’ll have such a financial panic even if the bear market resumes due to a future recession. But it’s certainly possible and worth remembering that the first move in both 2008 and 2020 was down hard for gold. Only after rescue policies were introduced did gold then proceed to rip higher. This suggests that those concerned about a sharp market selloff might want to keep some powder dry to add to their gold holdings at that point, rather than going all-in today.
Of course, if the Fed pulls off an elusive soft landing and avoids a recession, the case for gold diminishes. Not only would that remove several catalysts for higher gold prices (less deficit spending and no extraordinary Fed measures), but a more resilient economy likely would mean interest rates remain higher for longer as the Fed battles to keep inflation in check. And as we’ve seen, rising interest rates are typically not good for gold.
While it’s tempting to speculate regarding these potential outcomes, we recommend against doing so. Fortunately, the DAA strategy provides us with a process that distills all of this information into a simple recommendation of whether or not to allocate substantially to gold. Given how much gold’s path has deviated over the past few years from what would have seemed to be an exceptionally bullish path, having a mechanical process to guide our gold investing is invaluable.