
SMI’s last cover article on gold was more than five years ago. Since then much has changed in the economic outlook, and the metal has endured a prolonged, bruising bear market that knocked gold prices down 44%. SMI has changed too. In 2013, we altered our approach to investing in gold with the introduction of the Dynamic Asset Allocation strategy. Here’s a recap of gold’s recent history, along with a primer on how SMI suggests our readers interact with this volatile asset class, and an overview of what we see as plausible future scenarios regarding this widely-followed metal.
During SMI’s first decade (the 1990s), the price of gold was relatively quiet as it declined mildly from $350 to $290. Throughout that decade, gold promoters and detractors engaged in a spirited exchange of reasons why gold would or would not be the next big thing. The arguments went largely like this:
Gold bugs: “Just wait!”
Gold bears: “Investing in gold is dumb.”
Over the following 10+ years, things changed dramatically. The price of gold soared five-fold from $290 to a high of $1,895. Not surprisingly, the debate over gold shifted:
Gold bugs: “We told you so! It’s going even higher!”
Gold bears: “Investing in gold is still dumb.”
Over the past five years, the price of gold collapsed from $1,895 to $1,060, but in recent months has rallied back to the $1,360 range. And throughout the plunge and subsequent rise, the debate over gold has raged on:
Gold bugs: “Just wait!”
Gold bears:”We told you investing in gold is dumb.”
SMI’s evolving view of gold
Pretty enlightening, right? It’s difficult to know who to believe when it comes to gold. On one side are the fear-selling, permanent gold-enthusiasts (who, not coincidentally, tend to have businesses built around selling, storing, or writing about gold). On the other side are the Warren Buffetts of the world, who speak as if owning gold is the dumbest idea ever, regardless of what the metal has been doing lately. It’s like the modern political landscape, with lots of true believers on both sides and not much middle ground.
SMI’s position on gold has shifted over the years. Early on, we tended to mostly ignore it, which worked fine because it just sat there and didn’t do much. Ignoring gold became harder during the 2000s as its price started rising sharply. This was part of a broader rise in commodities across the board, a move that we were content to participate in second-hand through our Upgrading fund selections. The mutual funds that deftly navigated this commodities trend tended to rise in our momentum rankings, and those holdings helped propel the excellent results our Stock Upgrading strategy produced from 2000-2008.
Following the financial crisis in 2008-09, we devoted more attention to gold, primarily because of huge reader interest, but also because the inflation scenarios evoked by massive government stimulus and money printing seemed plausible. SMI’s counsel throughout this time was to limit gold to a small portion of your portfolio, and we wrote a few articles discussing how individuals could best purchase and store gold.
While we were comfortable with that general approach, internally the question of how to optimally handle gold within member portfolios remained unsettled until 2012 when we started developing SMI’s Dynamic Asset Allocation Strategy (DAA). Ironically, DAA’s origins stem from the work of a “perma-gold-bull” who advocated a static 25% position in gold. While that held no appeal for us, it did clue us into the idea that gold could be (and had been) a useful ingredient in conservative portfolio construction. Once we developed the approach of dynamically shifting between asset classes, we were finally able to “settle” the question of how to optimally interact with gold.
It’s important to understand that gold is a volatile investment. Though often thought of as a conservative investment, gold is prone to huge spikes and collapses, as well as long periods of time when the price doesn’t move much at all. Indeed, gold is so volatile at times that when we researched SMI’s Sector Rotation strategy nearly 15 years ago, we had to throw out the precious-metals funds because their extreme volatility was messing up the system — of our most volatile strategy!
So we were quite pleased when DAA provided us with a disciplined approach that enabled us to safely interact with gold on more than a “keep 5% in physical gold and then ignore it” basis. DAA had reliably provided historical signals to buy gold when conditions dictated it was wise to do so, but the real key was DAA’s uncompromising selling discipline that got us completely out when gold faltered, even if we hadn’t owned it very long.
A picture worth 1,000 words
The chart below shows the monthly price action of gold going back to its peak in January 1980. This chart is adjusted for inflation, which means that the older prices are shown in today’s dollars. In other words, when gold peaked in 1980, the actual price was $850/oz. But after adjusting that amount for the inflation that has occurred since then, our chart below shows that price at over $2,000/oz. This is a crucial adjustment, as it makes clear that even after the huge 11-year bull market in gold from 2000-2011, gold’s price still didn’t recover to its previous high. Given that a primary selling point of gold is that it is an excellent long-term store of value, that’s a pretty important point to be clear on.
Also, the chart is logarithmic, which means it reflects changes in percentage terms rather than dollar terms. Note that the distance from $400 to $800, representing a doubling in price, is the same as the distance from $800 to $1600. We did this to better illustrate the percentage changes resulting from the various DAA ventures into gold.
We’ve gone through the DAA research to identify each period when DAA would have been invested in gold for at least three consecutive months, and those periods are shown by the darker line. The entry/exit points are marked with dots. (There were some times when DAA called for gold, only to sell it a month or two later. The monthly nature of the chart makes those blips too short to see clearly.)
Observing DAA’s interaction with gold this way is very instructive. The most important point this illustrates is that DAA would have successfully steered us clear of every significant decline in gold’s price over the past 35 years. Given DAA’s mantra of “winning by not losing,” as well as the severity of some of gold’s declines, this is crucial.
Less obvious is that DAA’s interaction with gold when gold prices have been rising has been quite good. There are clearly numerous places where DAA was invested in gold and the gold price was increasing. But what about the other places where gold was rising but DAA wasn’t invested in it?
There are two points to make in answering this question. First, DAA was never intended to be an independent market-timing indicator for gold or any of the other five asset classes used in DAA. There are going to be periods when a specific class is doing well and DAA isn’t invested in it. That’s part of the slower, longer-term trend following that DAA is designed for. It’s supposed to catch the bigger, longer-term shifts in asset classes and position us accordingly. It’s not designed to respond to every short-term wiggle.
The second point is related, in that DAA is a relative-value system, rather than an absolute-value system. What that means is DAA measures the value of each asset class in relation to the value of every other asset class, not independently. So DAA isn’t simply measuring whether now is a good time to be invested in gold or not. It’s measuring whether, in relation to the other five asset classes in DAA, is it worthwhile to be invested in gold right now?
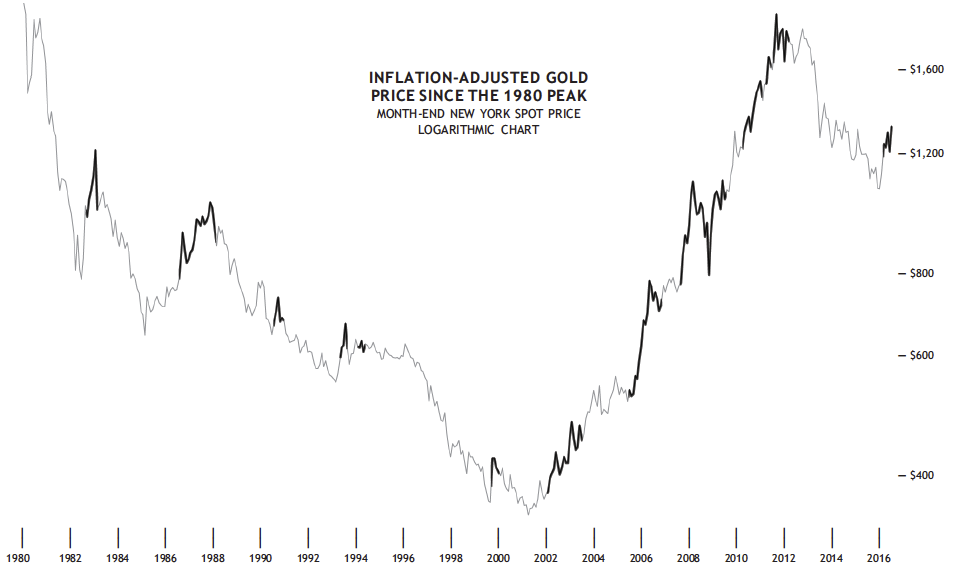
(Click chart to enlarge)
The chart provides some excellent examples of this point. Perhaps the most stark is the period from July 2003-September 2005. DAA was out of gold for all but two brief incursions during this 27-month period, which seems curious because gold was clearly in a strong, lasting uptrend. In fact, gold rose +35.5% during that 27-month stretch. But here’s where the relative value aspect comes in — that 27-month period was also very strong for the other asset classes. DAA rose +42.3% during that span — even better than gold’s performance.
So as we evaluate this chart, it’s important to recognize that it’s not necessarily a failure on DAA’s part if it wasn’t invested in gold during a period that gold was rising. It’s also instructive to recognize that DAA is an imperfect market timing indicator for any given asset class, because its recommendations are going to take into account the strength of the other five asset classes as well.
Ultimately, what the chart makes clear is that DAA would have done an excellent job navigating the treacherous waters of investing in gold. The perma-bulls spent those 35 years concocting arguments why everyone should invest in gold, while the perma-bears argued just as vehemently that doing so was a bad idea. We think DAA provides a better way than trying to figure out which of those camps is right.
SMI’s Recommendation
Not surprisingly, then, we think SMI members are wise to rely on DAA for the bulk of their precious-metals investing. Even then, an individual’s exposure to gold is going to vary, based both on how much of a reader’s total portfolio is allocated to DAA as well as whether DAA is invested in gold at the moment. It could range from as little as 0% (no gold recommended in DAA) to as high as 33% (if one’s entire portfolio is invested in DAA and gold is currently being recommended).
Of course, the gold exposure in DAA consists of “paper gold” in the form of exchange-traded funds such as GLD. Some analysts wonder if the paper will hold up and perform its function well during a period of rapidly rising gold prices brought on by an economic crisis. They still like the idea of owning some physical gold (or other precious metals such as silver), in addition to the on/off exposure provided by DAA.
That’s fine, but we suggest limiting this amount to a fairly small percentage of the overall portfolio. For most people, it’s reasonable to hold up to 5% of their total portfolio in physical precious metals, but we wouldn’t suggest going higher than that. In terms of portfolio impact, the potential downside of holding 5% of a portfolio in gold is pretty limited. If gold falls 20%, that total portfolio would only be down 1%. On the other hand, if something dramatic happened and gold was suddenly worth the $5,000-$10,000/oz. that the ardent gold bulls build their scenarios to justify, that’s a substantial boost to a portfolio, totally disproportionate to the downside risk.
For those who desire to own physical gold, bullion coins are generally the easiest to buy without worrying about big markups over the spot price. There are many to choose from: the American Eagle, Canadian Maple Leaf, and South African Krugerrand are the most popular in the U.S. Coins are reasonably easy to store in small quantities, as an individual could easily keep 20-25 coins in a home safe — a number that would likely put most people in the “5% of their portfolio” range. “Junk silver” bags — pre-1965 U.S. coins that are 90% silver — offer some of the lowest markups over the spot price of any precious metal, but they are also bulkier and require more storage space.
(For more on our suggestions concerning the purchase and storage of physical precious metals, see A Primer on Buying Gold Bullion.)
Three main factors when evaluating gold
Let’s briefly look at three of the main issues surrounding gold and its future prospects.
Gold as Economic Insurance
The rationale for holding a small amount of physical precious metals is based, at least in part, on the desire to insure against “low-probability but high-impact” events. This insurance property is the main driver for many people when it comes to owning gold. If you’re one of them, it’s worth considering exactly what type of scenario you’re trying to protect yourself from. If it’s an apocalyptic “cash isn’t worth anything anymore” scenario, it’s worth considering that other things — food, candles, knives, seeds, etc. — may be worth even more than gold.
But there’s a different “unlikely but plausible” risk that gold may be quite effective at protecting against — the risk of a change, or adjustment, to the monetary system. Many nations today are actively devaluing their currencies in an effort to boost exports and stimulate their economies. The result of this behavior is ever-more debt. It’s reasonable to wonder if at some point central bankers will realize they can’t possibly pay all this debt, and look for a way to collectively “re-price” their currencies.
Such currency adjustments have happened before. In the 1930s, Franklin Roosevelt took the U.S. off the gold standard and effectively devalued the dollar significantly by repricing it relative to gold (from roughly $20/oz. to $35/oz.). Other currency adjustments have occurred over the years — 1914, 1939, 1971, with some other close calls along the way. The U.S. has tended to be somewhat insulated given that the U.S. dollar has been the surviving “constant” in most of these adjustments. But who is to say that will always be the case, or that the next time might not require some pain on our part?
To be clear, SMI is absolutely not in the “dollar is going to fall” camp. We are not predicting this or saying it is likely to occur. It’s merely an acknowledgment that the world’s governments and central banks have gone so far off the historical map in their policies over the past decade that it’s impossible to know what the ultimate repercussions may be. Should there ever be a day when the dollar is no longer the world’s monetary anchoring point, or the system is re-pegged once again to the dollar but at a new rate that offers some relief to a debt-burdened world, gold would likely be a winner by virtue of simply not losing value while everything else is. Like many other forms of insurance, owning gold for this purpose is a long shot to ever pay a benefit. But if it does, the payoff likely will be significant.Inflation Versus Deflation
Immediately following the financial crisis in 2009, there was tremendous concern that the government’s massive new debt issuance and money printing were going to unleash a wave of inflation. In hindsight, the flaw in this argument was that in spite of huge amounts of credit being available, there wasn’t any demand for it—those who could afford to borrow didn’t really want to, and the banks weren’t terribly eager to lend anyway. So, much of that potential inflationary capital just sat idly on bank balance sheets. The demand for it didn’t exist.
What we’ve seen in the global economy over the intervening years has made it pretty clear that inflation is no longer the world’s problem. Rather, deflation is the bigger concern. The huge overhang of capacity built up at the end of the credit boom, coupled with global demographics that are leading to decreased consumption, have created an environment in which businesses aren’t incentivized to produce more, because there’s no demand for it. When the end demand is there, central banks such as the Federal Reserve can implement effective policies that reduce the price of money by lowering interest rates, which causes businesses to borrow in order to meet the pent-up demand. As a result, the economy grows, more workers are hired, the businesses pay off their loans, and it’s a virtuous cycle. But when the end demand isn’t there—when populations stop growing, get older and decrease their spending—it’s difficult for government actions to change the equation. That’s the deflationary environment the world has been stuck in, and there are no signs of it changing anytime soon.
There’s no question an inflationary environment is better for gold. Gold typically is a poor performer during deflationary periods — even if the deflation is accompanied by crisis. Consider that the price of gold fell -26% between July-October 2008, one of the few deflationary bursts we’ve seen. With weak global growth now accepted as “the new normal,” and the lingering impact of a huge debt bubble blown even bigger by the past decade’s efforts to reignite inflation, there’s little reason to expect the inflation/deflation winds to change in a way that would favor higher gold prices.Dollar Strength Versus Dollar Weakness
This was another confusing signal immediately following the financial crisis. Many, including the SMI team, looked at the U.S. response (federal government record deficit spending combined with the Fed’s Quantitative Easing policy) and assumed the massive debt/money expansion would ruin the value of the dollar. But those views failed to fully consider the international situation, where most of the other developed nations were even worse off than the U.S.
So while the dollar did in fact weaken relative to other currencies as the Fed launched its Quantitative Easing programs in 2009, it has since strengthened dramatically. Why? Because the Fed ended its version of those policies in 2014 while other countries have continued to pursue them, driving their currencies lower against the dollar.
It’s the “cleanest dirty shirt” in the closet argument — the U.S. looks strong only because the rest of the world is in worse shape. The U.S. has a weak economy, an aging populace and a lot of debt. But most other developed nations have even weaker economies, even older populations, and even more debt (relative to the size of their economies). So their currencies weaken relative to the dollar, and the dollar strengthens through little virtue of its own.
Given that dollar strength/weakness has explained much of the change in gold prices in the past, with a stronger dollar generally being bad for gold prices, it would seem that the trend toward future dollar strength would be a negative for gold. Yet lately the price of gold has been rising right alongside the dollar. So clearly there’s either a new dynamic in this equation, or the factors that supposedly govern these relationships are complex (or both!).
Conclusion
A deflationary global environment with a strengthening dollar is not a combination that historically has been favorable for gold. But thankfully we don’t have to examine these tea leaves and decide on an investment course — we can simply watch DAA and follow its signals!
Many expectations about gold and its relationships to money printing, inflation, dollar strength, and so on have had to be reevaluated in the years since the Great Recession. Thankfully, DAA provides a helpful roadmap to investing in gold — without having to interpret all of those clues correctly.