Let’s take a look at the recent stock market recovery. From its low on Christmas Eve, the S&P 500 is up +11.5%. However, because it takes larger percentage gains to offset smaller percentage losses (the "cruel math" of investing losses), the S&P 500 is still down slightly more than 10% from its all-time high. Which is significant, as we’ll see in a moment.
First, a quick recap of the past few months. The market set a new all-time high on September 20. It proceeded to fall almost to that invisible -10% line that would have denoted an "official" correction, only to bounce just short of that level. (I’m using all closing prices in this discussion; the intra-day numbers were different). The -10% level was 2,637 on the S&P 500, the market bottomed out in October at 2,641.
After rallying for a couple weeks, the market slide resumed in November. This time, the market cracked the 2,637 correction threshold, but only for a day, closing on November 23 at 2,632. The S&P 500 promptly bounced higher again for a week or so into December.
Things escalated quickly in December, taking the S&P 500 close to the -20% bear market threshold at its closing low of 2,351 on December 24. From there, once again, the market bounced higher for about a week into early January, before beginning to slide once again.
The market dynamic shifted significantly on January 4, for reasons we’ll get into shortly. But before we do, let’s quickly map out each of these market bounces just discussed.
10/29-11/7 | +6.5% | 7 trading days | Low = 2,641 |
11/23-12/3 | +6.0% | 6 trading days | Low = 2,632 |
12/24-1/2 | +6.8% | 5 trading days | Low = 2,351 |
1/3 – now | +7.2% | 9 trading days | Low = 2,447 |
The S&P 500 is currently at 2,623. That means it has nearly climbed back to the level of its October and November lows. That level also happened to be the -10% correction level for the market. And to make things extra interesting, 2,628 is the S&P 500’s 50-day moving average, which is commonly viewed as an indicator of the market’s short-term trend. It’s the first of the main moving averages market observers tend to pay attention to, as being above that level indicates the market’s short-term trend is positive, whereas below that level it is generally considered to be negative.
The point of all that is there is a confluence of interesting factors immediately ahead for the market: the resistance of the Oct/Nov lows, the -10% correction threshold, and the 50-day moving average. If the market brushes off all three of those over the next 20 points and continues chugging higher, that will be a significant statement and investor confidence will get a boost. On the other hand, it wouldn’t be unusual to see the current rally run into some resistance here for the first time since January 4.
One note about the table above — I broke the move from the December 24 lows into two separate lines, but it’s fair to point out that there was no lower low at January 3. So it’s reasonable to say the market has had a longer recovery that has already broken the pattern of short recoveries indicated by the way I presented them.
The reason I laid it out that way though is it was pretty clear the market was rolling over again by January 3. The market lost -2.5% that day and fear was palpable again. But things changed dramatically the next morning and the market has been off to the races ever since.
Enter the Fed
What changed on January 4? The same variable that has driven every other significant market direction change over the past decade — the Fed spoke up and, in effect said, "We were just kidding when we said back in December that we were a different Fed than in the past and that the financial markets weren’t going to dictate our decisions. We actually are paying close attention and probably won’t raise rates or continue the plan to reduce the size of our balance sheet if the market keeps declining."
And just like that, stocks got up off the mat and started climbing.
Back in 2012, I wrote this about the power of the Fed (and other global Central Banks) and their Quantitative Easing policies:
...several of the key 'Quantitative Easing' announcements have coincided with major turning points for the stock market.... Is there any question the market would have fallen further had the Fed not stepped in with huge promises of liquidity in November 2008 and again in March 2009? Is it a coincidence that QE1 wrapped up at the end of March 2010, and the market peaked less than a month later?
The end result of the July 2010 bear alert was still very much an open question until [then-Fed Chairman Ben] Bernanke telegraphed QE2 on August 27, 2010, triggering a huge rally.
Once again, as soon as that QE program ended (June 30, 2011), it took less than a month for the stock market to drop sharply. This time it was Europe’s central banks turn to step up and provide the liquidity blast. It took a while, but eventually they came through and the market was heading higher again by October.
It didn’t end there either, as the 2016 correction was directly tied to the Fed’s first attempt to raise interest rates in December 2015. That correction ended when the Fed backed off its plan to follow through with more rate hikes, which in fact they didn’t resume again until a full year later.
So for now, we have to deal with the uncertainty of the Fed potentially changing the rules of the game once more. If that is the case, our SMI systems will register that fact in time and shift us out of the defensive posture we began to adopt in mid-December. (Note that the systems don’t incorporate any of the specific items mentioned above. Those are interesting market events, but not important to the SMI process, which we will continue to follow.)
But the nagging question is this: Why was the market falling in the first place? The Fed Funds rate is still historically low at just over 2%, a level only roughly equal to current inflation. Normally when there has been a long economic expansion and unemployment is so low, interest rates are higher both in absolute terms and "real" terms, meaning the base interest rate is higher than the rate of inflation by some margin.
The answer is almost certainly tied to the "Quantitative Tightening" going on around the globe. This is the "shrinking of the Fed balance sheet" I mentioned earlier. That has been going on for a year or more, but the long-awaited tipping point of the net actions of the main global central banks turned negative during the fourth quarter of 2018 (meaning that for the first time in a decade, as a whole, those extra measures were being reduced rather than expanded). And immediately stocks ran into significant trouble.
How long will the game keep going?
I don’t pretend to understand all the implications, but it seems the market’s health is still tied very closely to two things: the belief that Central Bankers can keep the game going, and that they will keep it going indefinitely. At some point, the bubble in "Fed Belief" is going to pop and it’s going to be ugly. But no one really has any idea if that’s a short-term or long-term event. If anyone had said in 2008 when the first QE program was announced that the market would choke when the first real attempt to scale back global QE finally occurred more than a decade later, no one would have believed that those measures would still be in place and still playing a leading role in the market’s behavior.
As for SMI, we’ll continue to monitor our protocols and try to manage risk as those processes instruct. I’m grateful that we’re not in the prediction business because we sure seem to have a market that could go either way. There are real risks out there — from trade deadlines (March 1) to slowing global economies, and many more. Are the central bankers more powerful than everything else? They arguably have been in recent years, but it’s hard to imagine that dynamic can continue forever.
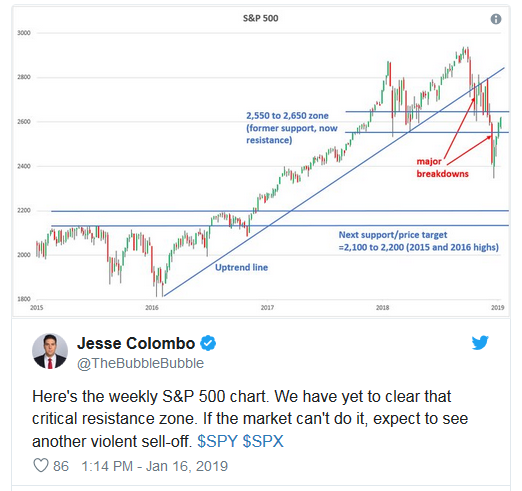
Update: Here’s a good visual of the "resistance zone" the market is currently trying to break through. For non-chart-watching people, the key to understanding this is that levels that provided support when stocks were falling typically then provide resistance when stocks are rising.