

As a follow-up to my post from yesterday, Significant Market Test Ahead, I want to highlight a few things from an excellent article by Bryce Coward, CFA, titled, What Does a Typical Counter-Trend Rally Look Like After a Big Drop in Stocks? It’s a short article, so I recommend giving the whole thing a quick read if you have time.
Whereas yesterday’s discussion focused on the potential resistance ahead for the stock market’s current rally, as well as the reasons for that rally, this article focuses squarely on what the market has done in the past following the type of decline we experienced in December. Here are the highlights.
Coward’s observations
It’s interesting to note that this is just the 20th example of a -15% "waterfall decline" in the post-war period. Defining that more clearly, the author is talking about -15% declines that didn’t have a "bounce" (i.e., counter-trend rally) of at least 5% interrupting the decline. We had that type of uninterrupted decline between December 3-24 when the S&P 500 fell -15.7%.
Coward makes the following observations about the preceding 19 examples of these uninterrupted -15% waterfall declines and their ensuing rallies:
The average counter-trend rally following a 15% waterfall decline is 11.9% (11% median) and it takes place over 21 trading days on average (median 11 days);
The rallies end up retracing 57% of the decline on average (median 52%);
Waterfall declines of at least 15% have only taken place in bear markets;
The average of those bear markets have a peak-to-trough decline of 33% (median 29%);
The duration of those bear markets is 284 trading days on average (median 139 days);
In 16 of 19 instances (excluding the decline we just witnessed), a recession was associated with the bear market;
100% of the time the low resulting from the waterfall decline was retested, and in 15 of 19 cases a new lower low was made.
I’m glad Coward includes the median (or mid-point value, where half the examples are higher and half are lower), because the averages can be distorted by one or two exceptions in a limited data set like this. The median arguably provides a better picture of what the "normal" experience has been.
Coward’s observations about the current counter-trend rally, based on these data:
First, this rally has already retraced 65% of the waterfall decline (greater than average and median) and has lasted about three weeks (less than average but greater than median). This suggests upside from here may be limited in both magnitude and duration.
[MB note: This was written last Friday; the market has added another few percent and nearly another week to the figures.]
Furthermore, these data strongly suggest the major index will retest the Christmas Eve low at the very least and most likely will make a new lower low in the weeks and months ahead.
While we are not forecasting a recession at this time, waterfall declines of the magnitude just witnessed tend to take place in recessionary market environments, so we need to at least be open to that possibility.
Finally, waterfall declines typically take place in bear markets lasting an average of 284 days (median 139 days). At just 81 days in duration, these data suggest we have bit further to run before we reach the bear market nadir. That said, there are four instances of waterfall declines taking place in short bear markets, so we don’t place much weight on this particular piece.
Recession watch
The two big takeaways from this are the following:
The historical pattern is that the type of decline we had in December has always been followed by a retest of those lows, and usually (79% of the time) a lower low has been made. It’s possible the current rally will be the one exception to this pattern, but the burden of proof is squarely on the bulls to buck the historical trend. Given the resistance ahead that we discussed in yesterday’s post, this would be a logical place for the current rally to run into trouble.
We have to start considering the possibility that a recession is closer than most experts think. Every day I seem to read someone saying "We aren’t currently forecasting a recession." It’s important to recognize that in every recession, people look back with amazement at how almost no one correctly forecast the recession! This is normal. Recessions aren’t obvious until after the fact. Coward’s data indicate that most of the time the market has behaved as it did in December, not only did a bear market result, but it was a bear market accompanied by a recession.
That is the combination to be concerned about — the ones SMI’s defensive protocols are designed to protect us from — as bear markets paired with recessions are the ones that are especially damaging. So it’s completely appropriate that our defensive protocols are currently engaged, as the historical interpretation of the recent data is that a bear market with recession is high probability outcome from here.
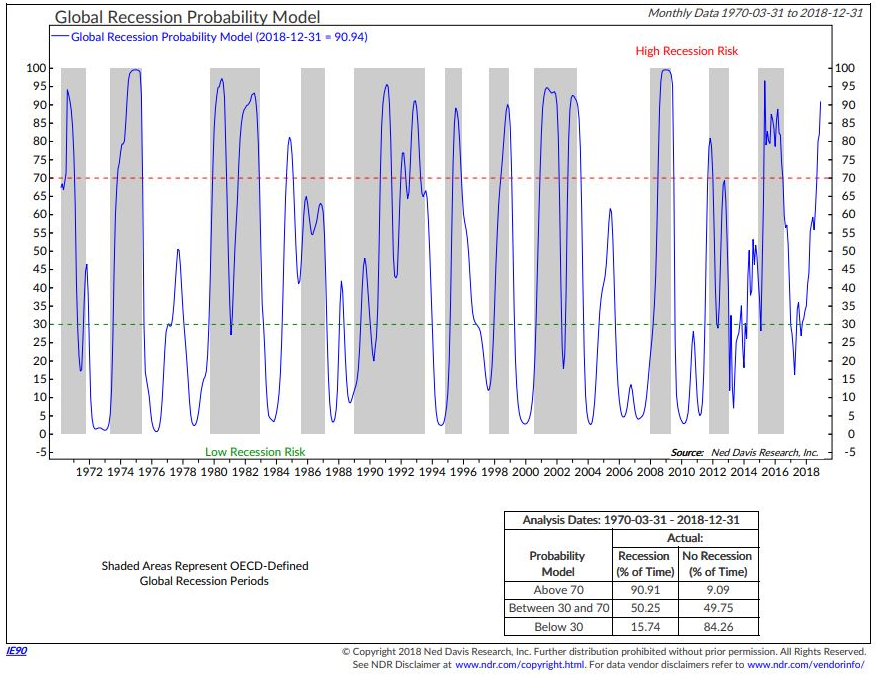
Developing that second point further, the recession indicators I watch are showing a greater likelihood. Steve Blumenthal of CMG Wealth updates a panel of "Trade Signals" each week and yesterday’s contained the following chart from Ned Davis Research. It’s important primarily because most of the recession forecasts we see/hear are focused on the U.S. economy, which is in significantly better shape than the rest of the global economy right now. But it’s probably wishful thinking to imagine that the U.S. can dodge a recession if the rest of the world ends up in one. According to this chart, there’s roughly a 90% chance we’re either already in or about to enter a global recession.
Past parallels?
The two "maybe not" scenarios I keep considering as possible parallels to today are 1998 and 2011. Both were similarly steep declines to what we suffered through in December, but neither immediately led to a deeper bear market. The 1998 scenario seems the more plausible of the two, given the high market valuations both then and today, and obviously in hindsight we know that a big bear was coming, it just wouldn’t arrive for another 18 months. The 2011 scenario seems less plausible, as valuations were lower than today and we were just coming out of a deep recession/bear market, whereas today we haven’t experienced either for over a decade.
That said, in both cases, the market had clear retests of the initial decline. You can clearly see those retests in these charts posted recently by Charlie Bilello on Twitter: 1998 and 2011.
The bottom line of all this information we’ve presented yesterday and today is simply this: there’s plenty of reason to still be cautious, despite the market’s January rebound. Thankfully, if you’re following SMI’s strategies, you can rest easy knowing that both Upgrading 2.0 and Dynamic Asset Allocation are running their unique processes to monitor how defensive our portfolios should be. As we’ve noted before, high volatility — demonstrated both in sharp declines and short-lived rallies — is a hallmark of bear-market behavior.
More than anything else, corrections and bear markets require emotional discipline to stick with the plan and trust your process. It’s so easy to get swept up in the emotional roller coaster as markets plunge and rebound. Know that the SMI strategy processes are robust and have been designed to not get "tricked" by the market’s shorter-term moves as we make our way through treacherous periods. If this time is different and the worst is over, that will become clear soon enough and our strategies will adjust. But at this point, most of the evidence continues to support a cautious — if not downright skeptical — outlook.