

Last week, I wrote about the rate-cut optimism that has recently driven the stock market to new highs. Today I want to dig into that a bit further and explain why this shift may mark the beginning of the end for both this decade-long long bull market and economic expansion.
First, there’s no question the markets are expecting the Fed to cut rates this month. The current Fed Funds futures show a 100% expectation of a July rate cut. The only question in the market’s mind is how big the cut will be: that expectation is currently split roughly 2/3 between a quarter-point cut and 1/3 expecting a half-point cut.
There’s a distinct "whistling past the graveyard" element in terms of the market’s reaction to this Fed pivot. In the span of just a few quarters, we’ve gone from "the economy is strong enough for the Fed to hike interest rates for the eighth time (that’s bullish for stocks!)" to "the economy is showing enough signs of slowing that a half-point rate cut could be in store (which is bullish for stocks!)."
The only way to explain that is the market has shifted from a "good news is good news" mentality to a "bad news is good news" mentality. This isn’t terribly uncommon. The market sometimes considers bad economic news to be positive — at least for the short term — because it boosts the chances that the Fed will cut interest rates (or provide more Quantitative Easing; i.e., somehow easing monetary policy).
Ove the past few decades, the Fed has come to the market’s aid so many times that investors reflexively start salivating when rate cuts are mentioned. Thus the current "bad news is good news response" in the market. These reactions are often dramatic. Consider that last December’s deep correction reversed on a dime and turned into 2019’s sharp rebound rally when the Fed announced they were pausing their rate hiking cycle and stopping the process of shrinking their balance sheet. More recently, the stock market was selling off significantly in May until the Fed started publicly talking about cutting rates, which stopped that decline dead in its tracks and kicked off the rise to today’s new highs.
This isn’t new. Every significant market decline of the past 10 years has ultimately been stopped by some type of significant Fed (or global central bank) action, as shown in the chart below from NorthmanTrader:
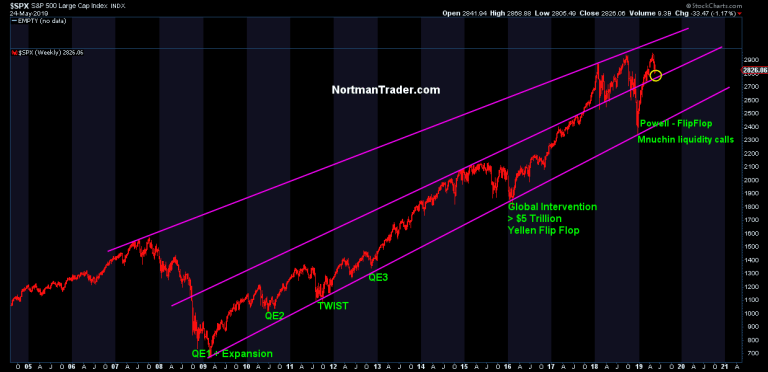
Click Graph to Enlarge
So why is it different this time?
If the Fed has been able to successfully stop each of these past market declines, what makes this recent shift any different? The answer is two-fold.
First, the amount of "bang for their buck" that the central banks have gotten for their stimulative efforts has been less and less as this decade has gone along. These diminishing returns lead to the unpleasant but wholly logical thought that the Fed can’t simply keep levitating the markets indefinitely. We know this point will come, because the Fed always cuts interest rates aggressively when the economy slips into recession and a bear market in stocks begins. But there comes a point in every cycle where the economy and stock market are beyond the Fed’s ability to rescue with monetary policy.
In fact, the primary reason the Fed hiked interest rates nine times in the recent hiking cycle wasn’t to try to keep a lid on a booming economy, as it sometimes has been in the past when the economy would run too hot and inflation would rise. There’s been very little inflation to speak of throughout this recovery — it has consistently fallen short of the Fed’s stated 2% target. No, the reason the Fed hiked aggressively in 2017-2018 was to give themselves more ammunition for the next downturn. The Fed has historically cut rates by ~5% during past recession/bear markets. With a Fed Funds rate less than half that today (~2.25%), they’ve been concerned about their ability to provide sufficient stimulus during the next downturn.
But the more important reason why we might expect the Fed’s next actions to lead to a less positive result has to do with where the economy stands now. Over the past decade, while U.S. economic growth has been relatively weak by historical standards, it has been relatively steady, with few recessionary scares. That’s been changing lately.
Unlike most of the past decade, the economic picture today is darkening sufficiently that recession is a realistic near-term possibililty. That may be surprising to some, given how recently we were being told the skies were sunny and the forecast was clear. It’s also true that economic conditions here in the U.S. aren’t noticeably bad — certainly not to the point where anyone would be looking around thinking we might be on the verge of a recession.
Unfortunately, that’s no comfort, because this is always the case immediately prior to recessions. But there are any number of historical indicators lining up to suggest a recession could be closer than most suspect.
Many consider today’s record-low unemployment rate to be proof that the economy is healthy. Unfortunately, that’s not the case — long, sustained reductions in unemployment always precede recessions. And as this Forbes chart points out, when unemployment drops below 4%, recessions have always been close at hand.
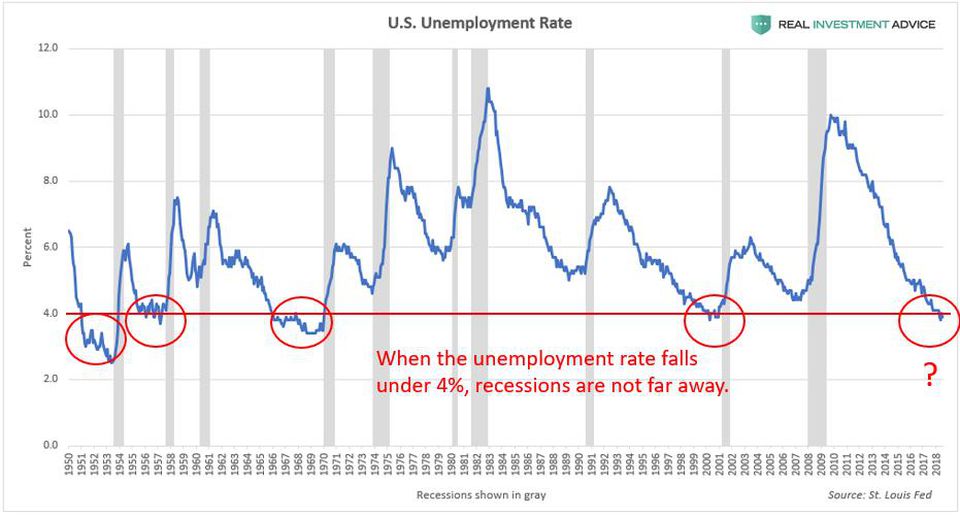
Click Graph to Enlarge
One of the most consistent recession predictors has been an inverted yield curve. We’ve written about this before, but here’s the short summary: when short-term interest rates are higher than long-term interest rates over an extended period of time, a recession has typically followed (although often after a delay). The New York Fed tracks the probability of recession based on the inversion of the 3-month and 10-year yields, which first inverted in March, and has remained inverted since May. Importantly, as the chart below shows, when this measure has reached 30% or higher in the past (it’s at 32% now), the economy has either already been in recession or about to hit one. We have to go back over 50 years to find the last case where that wasn’t true.
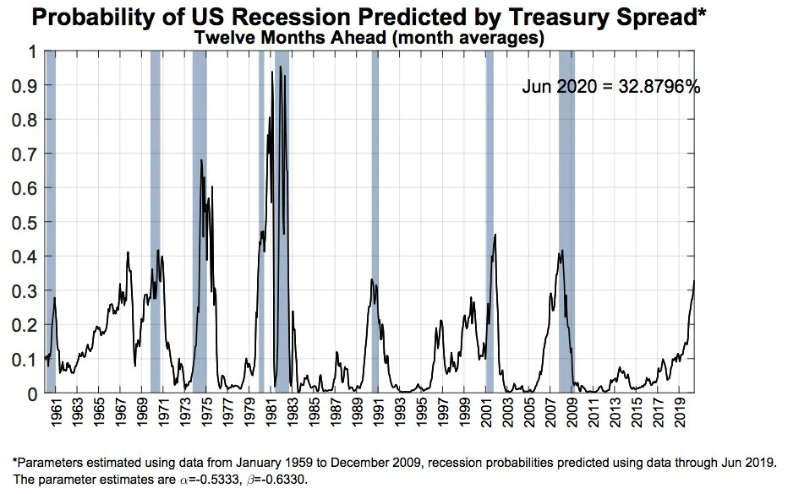
Click Graph to Enlarge
There are lots of other indicators we could look at that tell a similar "the economy is slowing and recession probabilities are rising" story. Scroll through this recent post from Steve Blumenthal (just looking at the charts) if you’re interested in seeing more.
Great, but what should I do with this information?
To summarize what we’ve covered, the market is cheering the prospect of Fed interest rate cuts, but they’re not really good news because the Fed is only cutting in response to a legitimate increase in recession risk. As we’ve noted before, there are recessions that don’t cause significant bear markets, and there are bear markets that occur without recessions. The really bad outcomes have resulted when elevated financial asset prices collide with economic recession. We have high stock market valuations today, which is why we’re waving the caution flag.
However, that’s not the same thing as making a market timing call that the top is in and you should sell. Long-time SMI readers know we don’t operate that way, but I want to make it crystal clear for newer readers.
I’ve said it countless times over the past 20 years, but I’ll repeat it again: Investors don’t deal in certainties, they deal in probabilities. When I show a chart that says "every time X has happened in the past, Y has followed," I hope you realize that does not guarantee Y will happen the next time. There are no guarantees in investing. The best we can ever say is the probabilities have shifted in a certain direction.
The goal of this article is to explain why this recent shift in Fed policy — to cutting interest rates for the first time since the Financial Crisis 11 years ago — indicates the probabilities of an economic recession and bear market in stocks have increased significantly. We’ve been cautious about this market for a while now, so it’s possible this warning will also turn out to be early. But we’ve also stated for years that the end of this market cycle would likely be driven by the Fed’s monetary policy changes. That’s the new catalyst we see happening today. The market always cheers the beginning of a rate-cut cycle, but historically rate cuts that follow a rate-hiking cycle haven’t been good news for the market, at least after the initial reaction fades. On the contrary, they usually signal danger ahead.
These market cycle changes are a big deal when they occur. Think back to 2008, or 2000. So even though we don’t invest based on predictions of when these cycle changes will occur, nor do we want people to be taken by surprise or unprepared when they arrive.
If you’re investing using SMI’s strategies, there’s no need to take any specific action in response to this information, as the strategies themselves will respond as market events confirm (or fail to confirm) these trends. If you’re not using SMI strategies, it would certainly be wise to consider how you plan to handle a potentially significant decline in stock prices at some point in the next few years (maybe sooner). SMI’s Upgrading and Dynamic Asset Allocation strategies have defensive protocols built into them to help limit the potential damage of a downturn, and some of those protocols (from Upgrading 2.0 specifically) can be applied to an indexed portfolio in a 401(k) or other workplace plan.