We’ve been witnessing tremendous daily volatility in the stock market recently and today is no exception. That said, the primary catalyst for today’s plunge lower — the "official" inverting of the yield curve — is a big deal and I’m already seeing a ton of commentary about it, so it’s worth taking a few minutes to discuss.
For those unfamiliar with the yield curve, here’s a quick explanation. Short-term bonds usually yield less than longer-term bonds, as investors normally want higher compensation for putting their money at risk for a longer period of time. When this normal pattern is broken and shorter-term debt has higher yields than longer-term debt, it’s referred to as a yield-curve inversion. The reason this is a big deal is yield curve inversions have preceded every U.S. recession in the past 50 years or so. We’ve written more extensively about the yield curve in the past and here’s another good primer from MarketWatch if you want more detail.
To understand why the market is reacting so strongly to the yield curve "officially" inverting today, we need to back up a moment and talk about recessions. The commonly used definition of a recession is when the economy contracts — or experiences negative growth — for at least two consecutive quarters. There are two things that are really tricky about that though.
1. Measuring an economy as massive and complex as the U.S. economy is difficult and it takes time to do it accurately. Every month the government issues estimates of how fast the economy has grown (or contracted) recently. But it also revises its estimates of past quarters as additional data help clarify what actually happened in those prior quarters. So, at best, even if an initial estimate immediately showed the economy contracted during the prior quarter, that information is essentially three months old. To get two consecutive quarters of economic contraction (the definition of a recession), that means the official pronouncement that a recession is underway would be roughly six months after the fact. And that’s under the very best of circumstances, where the negative growth is recognized accurately right away. Normally, what happens is we see progressively weaker growth for a few quarters, and eventually, some of those weaker quarters are revised from positive growth to negative growth, until a recession ends up being recognized in hindsight.
Hindsight doesn’t work for the stock market though. Investors are always trying to anticipate what’s going to happen in the future. So any indicator that proposes it can signal in advance when a recession is coming is going to garner a huge amount of attention. Thus the fixation on the inverted yield curve.
2. Given that the official measures of recession are all "in hindsight" type of readings, you’d expect that economists would be ultra-focused on figuring out how to predict when recessions are coming. And they are — the financial media is constantly full of analysts offering reasons why the economy is/isn’t trending toward recession. The problem is that economists are uniformly horrible at predicting recessions.
I really can’t underscore that last point enough. I could give countless examples of the folly of recession forecasts, but I’ll restrain myself to just this one from "Recessions? Never Consensus, Always Hiding in Plain Sight," written in January by Reuters’ senior economics correspondent Jamie McGeever:
As Morgan Stanley Investment Management’s Ruchir Sharma notes, professional forecasters have missed every U.S. recession since such records were first kept half a century ago.
In August 2000 the Philadelphia Fed’s Survey of Professional Forecasters raised GDP forecasts for the first two quarters of 2001 to 3.0 percent and 2.7 percent, respectively. The recession would start in March.
The Great Recession began in December 2007. In May 2008, having already failed to spot two quarters of negative growth, the survey reported: “The forecasters do not expect a contraction in real GDP in any of the next five quarters.”
Just to be sure everyone understands exactly what that last paragraph is saying, let me re-phrase it this way: After all the past revisions were completed, it was determined that the Great Recession — the worst in a generation — had started in December 2007. However, a full six months after the recession had already begun, Reuters’ poll of economists was forecasting that they didn’t anticipate a recession would begin at any time in the next 15 months.
That’s almost unbelievable, but it’s actually par for the course. And it’s not that these economists are idiots, it’s just that recessions are really tricky to forecast. Just the quarter before the Great Recession started, the economy posted something like a 4% growth rate, which is great. The point of this is to absolutely not trust any forecast you see about when a recession is likely to begin. The U.S. economy is a complex system, with many moving pieces, which makes it difficult to predict how any particular factor is going to impact it.
Yield curve has been effective at cutting through the noise
Bringing this discussion back around to the yield curve, the horrible track record of economists in predicting future recessions is another reason why so much attention is paid to an inverted yield curve. While forecasts have done a horrible job of predicting future recessions, the inverted yield curve has been one of the few indicators that has been pretty reliable in signaling in advance that a recession is coming.
Where this gets a little tricky is the yield curve is composed of several different bond yields of varying lengths. Specifically, the ones that are paid the most attention include the 1-month, 3-month, 6-month, 1-year, 2-year, 5-year, 10-year, 20-year, and 30-year. Collectively, they make the "curve" we keep mentioning. However, when it comes to the curve inverting, this happens at different times for each specific pair of data points.
To illustrate this, we need look no further than the two most widely-followed pairs of data points. The inversion that is sending the market tumbling today is the 2-year and 10-year Treasury yields. Normally, the 10-year yield is higher than the 2-year yield, but this morning that relationship briefly inverted with the 10-year yield falling below the 2-year yield for the first time in more than a decade.
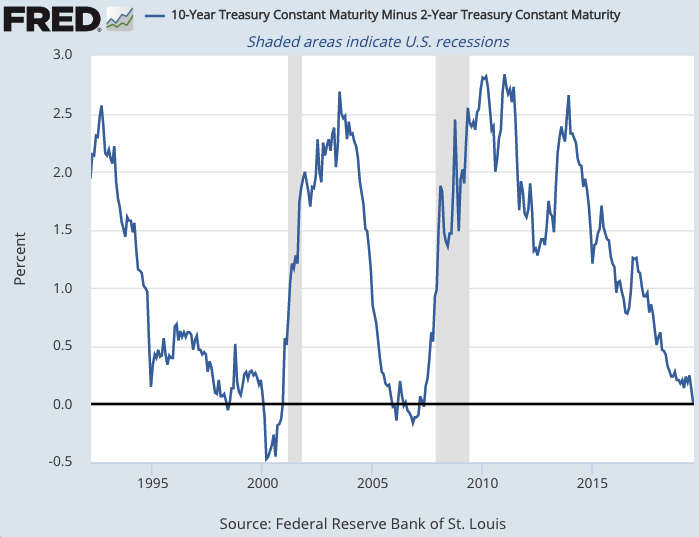
However, another widely-followed pairing has been inverted now for most of the past three months after first inverting five months ago. That’s the 3-month / 10-year pairing, which from what I can tell is the pairing that the first big academic paper on yield curve inversions focused on when this whole inversion issue rose to prominence in the 1980s. I’m not sure why the 2-year / 10-year has surpassed it in importance (at least in the financial media’s eyes), but I suspect there’s a fair amount of simple denial involved. As in, "Yes, the 3-month / 10-year curve has inverted and usually whenever this has happened and it has stayed inverted for a few months it has meant the economy is headed for a recession. But the 2-year / 10-year curve hasn’t inverted, so until that confirmation comes we’ll continue to hope for the best." Today was confirmation day, thus the market reaction.
Timing and the "clear skies" narrative
While the inverted yield curve has the best track record of any "recession watch" indicator we’re aware of, one huge flaw is it often operates with a substantial lead time. So even when it’s right, the recession that follows often doesn’t arrive for many months. I’ve seen a flurry of articles today pushing this type of "clear skies ahead" narrative, citing statistics like this: "Over the past 50 years, 10-yr/2-yr yield curve inversions have happened an average of 19 months before the next recession and 12 months before the final peak in the S&P 500." This Bank of America/Merrill Lynch report says the S&P 500 has typically peaked 7.3 months after a 2/10 inversion like today’s. The obvious inference of all these types of articles and statistics — the stock market has a ways to go before it peaks.
To which I would simply add, maybe it will and maybe it won’t. Averages and historical examples are helpful, but they can provide a false sense of security. The same type of statistics were trotted out last month when the Fed cut interest rates for the first time in 11 years — the stock market typically gains X% in the Y months following the first rate cut. Fine, but we don’t have to look any further than the last time the Fed cut rates to see that the market peaked exactly 3 weeks after that first cut! Similarly, with the 2/10 yield curve inversion, the past five examples of inversion (dating back to 1978) show that the market has continued to rise for 20, 22, 19, 3, and 1 month following inversion. That yields a long average, but 1) there aren’t very many data points to draw from there, and 2) how willing are you to bet that this time isn’t the 1-month variety?
So beware the "clear skies ahead" narrative. But neither should you fall victim to the "sell everything!" panic narrative, because it’s true that the market could have substantially more runway ahead of it. Things looked bleak at the beginning of this year when the 2/10 yield curve came within a whisker of inverting, but the market came back strong and we’re higher now eight months later. That type of scenario is absolutely possible again.
That said, it’s not as if this 2/10 inversion is happening out of the blue. As I noted earlier, the other widely-watched 3-month/10-year inversion first happened five months ago. So even if we do get a typical "clear skies" period following the first yield curve inversion, who’s to say that countdown didn’t begin five months ago rather than today?
Yield-curve inversion is one factor, not the only factor
To wrap this up, remember our earlier point about the complexity of the economy and the fact that there are many factors to consider, not just one — even if that one has as strong a track record as the inverted yield curve. Today’s yield curve inversion was accompanied by two other pieces of news, neither one good. First, Chinese industrial production growth fell to its lowest level in 17 years, which regardless of how you feel about the ongoing trade war, it’s a clear sign that the world’s 2nd-largest economy is stumbling. Second, Germany (which is the European Union’s largest economy) contracted -0.1% in the second quarter of 2019. Those are two really clear signs of economic weakness abroad. I don’t believe there’s any way the U.S. avoids recession if the rest of the world slips into one, and these types of reports are increasingly weighing on the stock market. At least on days that the Fed isn’t promising more rate cuts.
I say that only partly in jest, because I think the clearest take away from today’s trio of news items is that last month’s Fed rate cut wasn’t just a "mid-cycle correction" as they tried to label it. Unless there’s a huge unexpected change in the future data, that was the first cut of a new rate-cut cycle. And it’s increasingly easy to frame the Fed’s actions over the past couple of years as fitting the common pattern of recent decades: low rates left in place for way too long, then rate hikes that go too far and begin to cut off economic growth, ending eventually with a Fed-induced recession and a bruising deflating of the asset bubble inflated by years of easy money. We appear to be on track for a repeat, the main question being, "When?"
Conclusion — Plan, don’t fear
I’m not going to try to spin this as good news. People who say things like "Recessions are normal and healthy" tend to be the type of people who aren’t particularly hurt by recessions! That doesn’t make it untrue, but the reality is a lot of people are hurt by recessions and bear markets.
However, Philippians 4:4-7 gives us our marching orders, even in these types of circumstances:
Rejoice in the Lord always. I will say it again: Rejoice! Let your gentleness be evident to all. The Lord is near. Do not be anxious about anything, but in every situation, by prayer and petition, with thanksgiving, present your requests to God. And the peace of God, which transcends all understanding, will guard your hearts and your minds in Christ Jesus.
How do we avoid fear-based decisions at times like these? We follow the directions above. And as investors, we operate from a plan rather than an emotional response.
The good news for SMI investors is that if you’re using a blend of SMI’s strategies that’s anything like the 50-40-10 blend we often discuss as a good starting point, you’re already following a reasonably conservative plan. Most people in that situation likely don’t need to do anything further, as those strategies will adapt to changing market circumstances and should provide a healthy buffer against any future bear market. That doesn’t mean they won’t lose any money, but there are at least some defensive measures in place. The performance of Dynamic Asset Allocation recently has been a good example of this, as two-thirds of its portfolio has been performing great on days like today when the stock market has taken big hits.
As investors, we have to remember that we’re always dealing with probabilities, not certainties. Today’s 2/10 yield curve inversion is a pretty significant shoe to drop, when considered against the fact that we already had high stock valuations and quite a few signals that the economy, both here and abroad, is starting to weaken. Those factors appear to boost the odds of a recession and bear market in the not-too-distant future. But we’ve also seen the Fed be extremely aggressive about heading off stock market declines in recent years, and we’ve watched the market be repeatedly very responsive to those efforts. So it’s impossible to say what the timing might look like, even if today’s inversion ultimately leads to recession, as most past inversions have.
Ultimately, the best course is to follow your individual long-term plan and the SMI strategies as they’re laid out. DAA and Upgrading 2.0 have been specifically designed for periods such as this, when we don’t want to rush prematurely to the exits late in bull market cycles, but we don’t want to lose a fortune in an upcoming bear market either. Both have done a very good job at protecting capital in past bear markets and setting us up for the opportunities that always exist on the other side of those bear markets. There’s no reason to believe they won’t be effective once again, no matter how this particular cycle unfolds from here.