In the decade since the 2008 financial crisis ended, interest rates have dominated most discussions of the economy and financial markets. The Federal Reserve assured this would be the case by lowering short-term interest rates nearly to zero and keeping them there for years. Now, in the third year of their effort to “normalize” short-term interest rates through a series of gradual increases, the topic of the yield curve is getting hot once more.
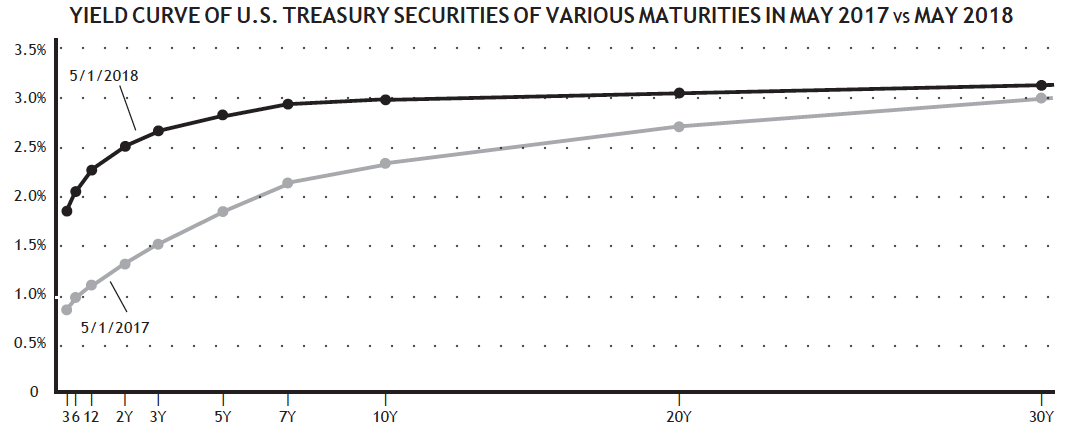
The yield curve is simply the plot of interest rates paid on Treasury bills and bonds of varying lengths. For example, the chart below shows what the yield curve looked like on May 1, 2018, compared to that same plot one year prior.
Click Chart to Enlarge
The key to understanding the yield curve and its implications is to recognize that the Fed controls short-term interest rates, but the bond market sets longer-term interest rates. Looking at the chart, it’s clear that short-term interest rates (three months out to three years) have risen fairly dramatically over the past year, but long-term interest rates (20 years and longer) have risen only slightly. This has caused the yield curve to “flatten” — in other words, the gap between short- and long-term interest rates has narrowed.
The reason for this is the Fed has been steadily raising the short-term rate, claiming to fight the higher inflation that is likely to occur as the economy continues to grow stronger. So short-term rates have moved higher. But the bond market doesn’t seem to believe that story. If the bond market thought inflation was going to rise significantly, bond investors would demand higher yields on longer-term bonds. Yet longer-term rates have stayed low.
The slim difference in yields between shorter-term and longer-term bonds further reinforces that point. When investors are willing to accept such a small increase in yield in exchange for tying up their money for several additional years, it likely means they don’t believe the economy will be strong enough to push interest rates higher.
An inverted yield curve has been a reliable recession indicator...
The primary reason economists and investors pay so much attention to the yield curve is it has a strong record when it comes to predicting economic recessions. Specifically, when the yield curve inverts — meaning short-term rates move higher than long-term rates — the economy is in serious danger of falling into a recession. In fact, the yield curve has inverted prior to all nine U.S. recessions that have occurred since 1955.
The fact that the gap between short- and long-term rates has recently narrowed to its closest point in the past decade is starting to get the attention of economists — and investors.
Stock-market investors pay close attention to recession warnings (and thus, the yield curve) for two reasons. First, recessions increase the chances that a bear market will occur. But recessions also make the severity of bear markets much worse than those that occur without a recession taking place.
But it’s important to note that the yield curve hasn’t inverted yet, and isn’t even all that close to doing so. John Williams, President of the San Francisco Federal Reserve Bank, acknowledged in April that while the yield curve is a “very clear symbol that the economy’s about to go into a recession,” he also stated that he doesn’t anticipate an inversion. This is certainly possible if economic growth continues to be strong, as long-term rates will likely rise along with short-term rates if the bond market starts to believe the Fed’s “future growth, future inflation” outlook is accurate.
...with a long lead time
The “good news, bad news” aspect of the inverted yield curve’s predictive ability is that while it has been a strong predictor of future recessions, it also operates with a long lead time. Looking at recessions of the past 50 years, the yield curve has inverted an average of 18 months prior, with the shortest lead time being 13 months. Investors will start selling stocks sooner if they believe a recession is coming, but inverted yield curves also preceded the start of bear markets by an average of 10 months during that same period. So while an inverted yield curve is an ominous sign that should certainly be noted, it’s also not a signal that you want to act on before it has even triggered. Given that the yield curve hasn’t yet inverted — and may not for some time, if at all — there’s no reason to act simply because the curve has been flattening.
Takeaways for SMI investors
Despite the strong predictive track record of the inverted yield curve, every time it occurs a group of experts step up to explain why it doesn’t apply this time. This is predictable, given that the yield curve normally inverts while economic conditions are still strong. Consider the last two times it happened, in early 2000 and late 2006. Both of those periods, like today, were periods of strong economic growth and optimism about the economic future. Granted, we’ve demonstrated there’s a long lead-time between inversion and recession, but this pattern of behavior indicates the economy can shift from great to recession a lot faster than people think.
Most importantly, if you’re following SMI’s strategies — specifically Fund Upgrading and Dynamic Asset Allocation — you already have more sophisticated defensive protocols built into your portfolio than trying to time portfolio selling based on the yield curve. Selling stocks because you think the market will fall in the future, whether based on an inverted yield curve or any other reason, often comes at a considerable cost.
Recent data from the Wells Fargo Investment Institute indicate that the market often rallies significantly between a yield curve inversion and the beginning of a bear market. Their data showed that large-cap U.S. stocks rise an average of +24.2% in the 12 months before the start of a bear market, while small-company stocks average gains of +36.4%! So if the yield curve normally inverts an average of 10 months prior to a bear market, you’d be giving up most of those gains if you exited stocks right away and events then followed their normal timetable.
Of course, those are only averages and events could unfold differently this time. But this research supports the rationale behind SMI’s defensive strategies, which were purposely designed to wait until stock prices have actually begun to fall. This helps us stay invested for the final stanzas of the late bull market, harvesting those significant gains, while still shifting to a more defensive posture in time to mitigate the worst damage of subsequent bear markets.