Yesterday was the worst single day many investors have ever experienced, as the S&P 500 index fell -7.6%. That was the 7th-worst day for the S&P 500 since 1950.
And as Nick Maggiulli points out, for most younger investors it was "the worst day of our investment lives," while most older investors — who may have lived through worse during the 2008 meltdown — probably felt yesterday more deeply simply by virtue of having more money at stake than they did back in 2008.
(I’d quibble with that last thought, simply because we had four days as bad or worse than yesterday between September 29-December 1 of 2008. The cumulative impact of those was much worse than yesterday, at least in my memory.)
Thankfully, SMI investors had DAA to cushion the blow yesterday. That portion of our portfolio actually gaining +0.28% yesterday was a lifesaver, roughly cutting the loss of a 50/40/10 portfolio in half. And of course, the more bonds a person had in the Upgrading portion of their portfolio, the more any downside was mitigated even beyond the impact of DAA.
Different this time?
No one knows where this market is heading next, given the huge uncertainties still surrounding the coronavirus. As Michael Batnick posted last night, this (almost) bear market has been far and away the fastest decline to (nearly) reach that "bear market" status.
On average, it has taken 255 market days for the Dow to hit -20% bear market territory from its prior high, and if you use the median (line up all the examples and take the middle one), that number is still 156 market days. The fastest decline from high to bear market was 1929, which took 36 market sessions. We haven’t quite hit -20% in this downturn, but the Dow was -19% at last night’s close...just 17 sessions after it’s February 19 high. So the decline of the past few weeks has been roughly twice as fast as the prior fastest bear market on record.
While we can’t rule out that "this time is different" (it has been so far, after all), the simple fact is that it’s usually not. The historical pattern of bear markets is not to fall sharply and just keep going. Instead, bear markets almost always have strong countertrend rallies. If this correction is destined to become a significant bear market, history suggests it would be much more common for it to play out along the lines of the charts I’ve recently posted here and here.
The layout below of how a bear market might unfold by technical analyst Northman Trader is instructive, not because it’s convincing that this is where the market is heading (nobody knows that and we’re definitely not predicting it will play out like this!), but because it shows how if we are heading to a bear market, the expectation from a technical basis would be for a very substantial — you guessed it — countertrend rally to push the market back higher soon (the yellow up arrow).
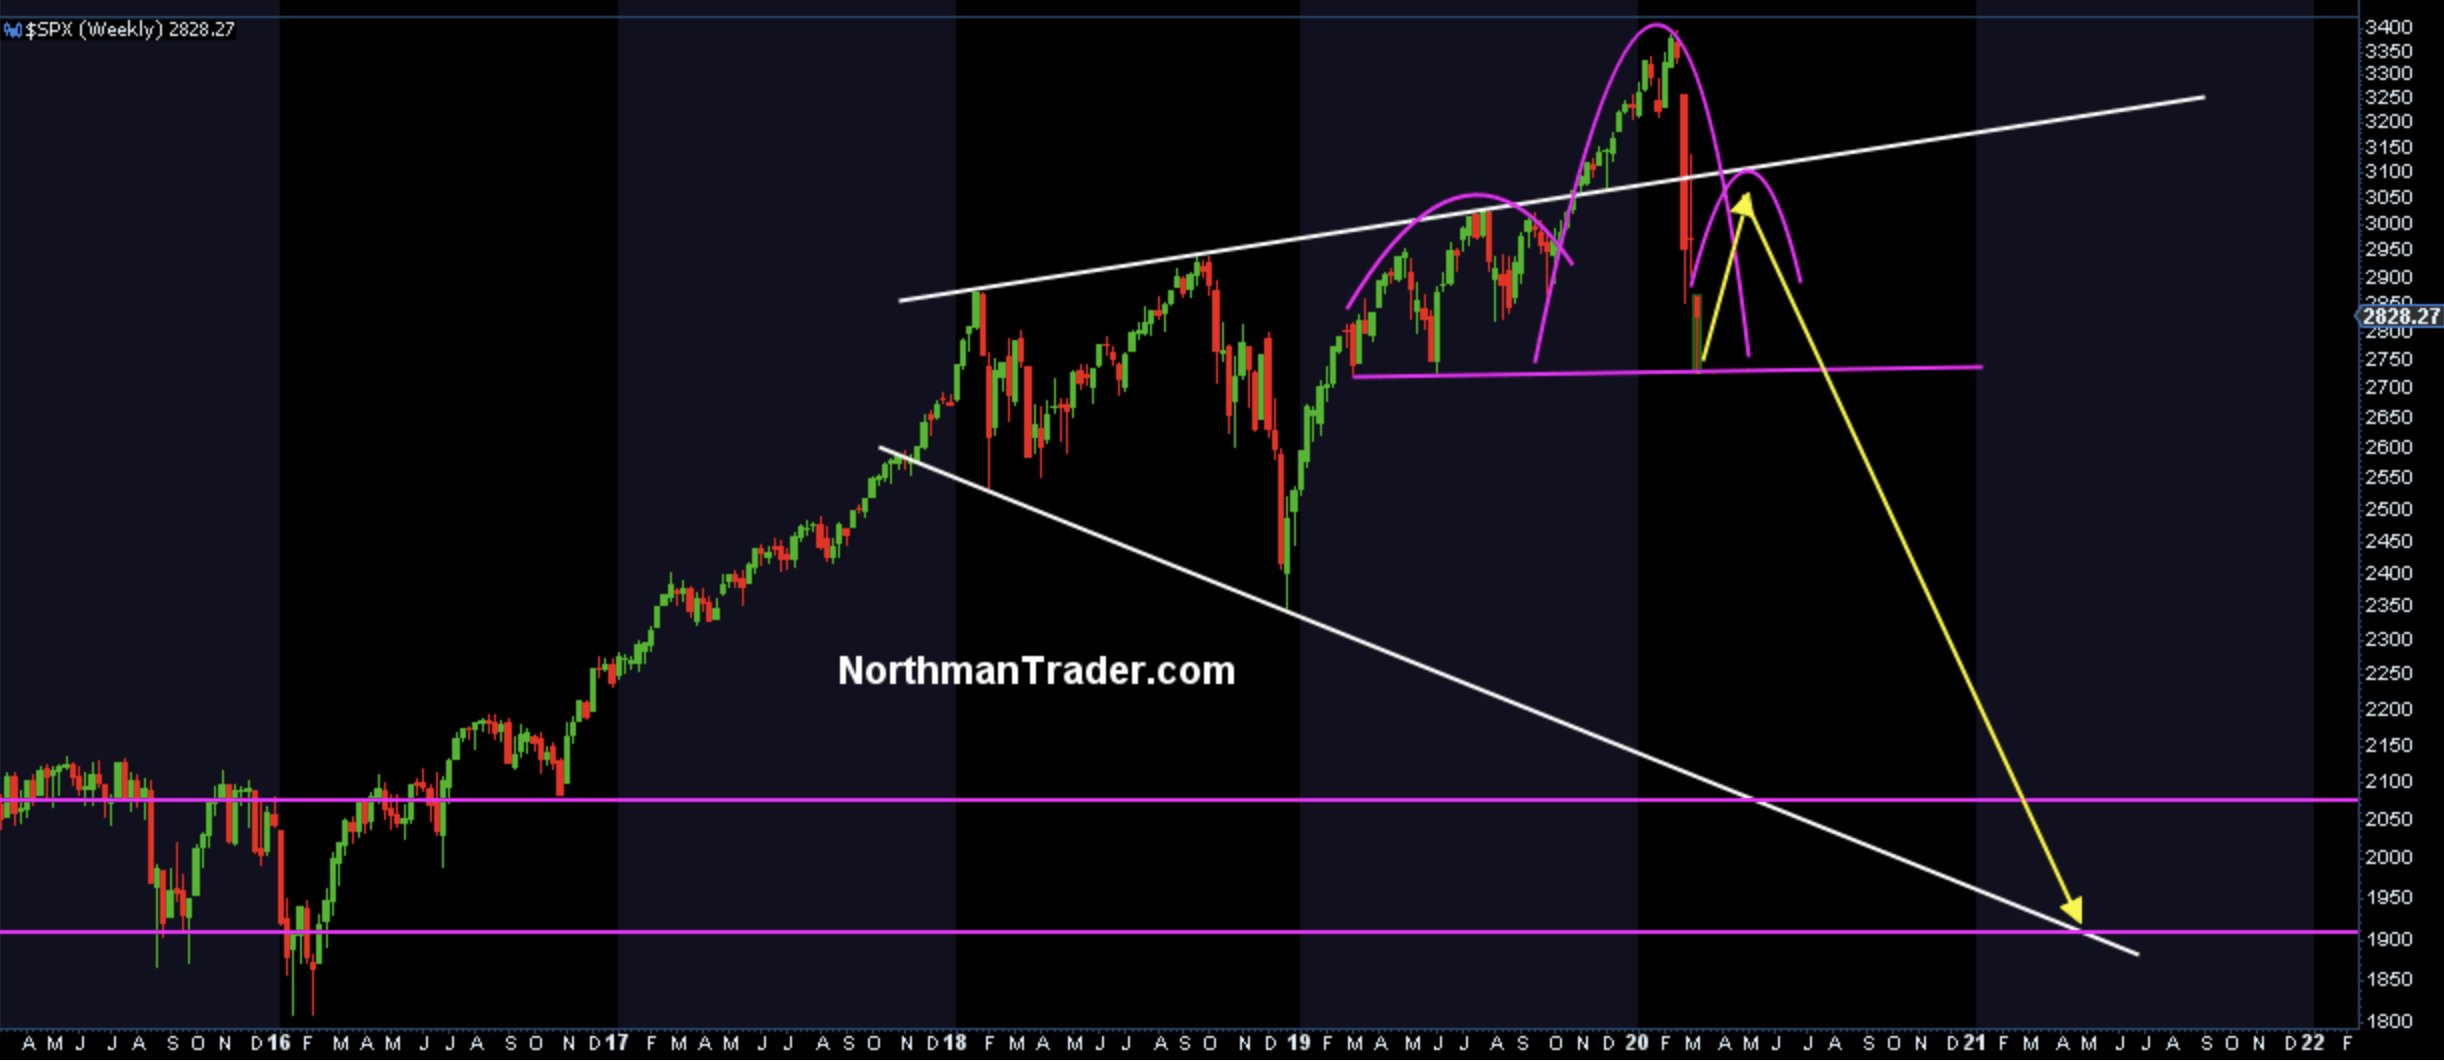
Click Graph to Enlarge
We’re not technical analysts, nor do we typically pay much attention to this type of chart. I present it only as further confirmation of the historical record of how bear markets typically play out, which is slowly with a fair amount of back and forth. (Note that while his chart is simply showing a straight line drop after the big rally, he would surely acknowledge the likely path of that long drop would be jagged with similar declines and counter-rallies all the way down.)
Historical numbers
I’m getting a bit into the weeds here, so let’s pull this back on track. With that idea that bear markets typically don’t move solely in one direction firmly in mind, the following data is interesting. Bespoke Investment Group compiled all the days since 1952 when the S&P 500 fell at least -5%. Their focus is on which day of the week those happened on, but ignore that and focus just on the bottom line of the table that shows the summary of all such days.
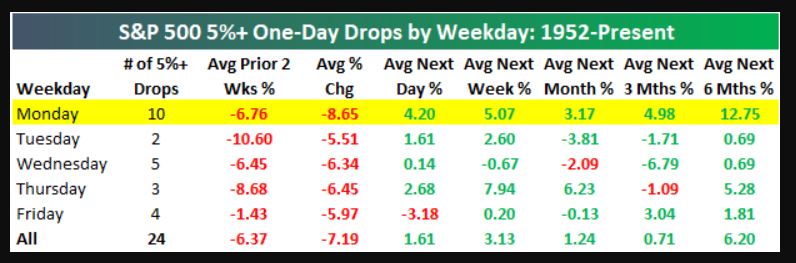
Click Table to Enlarge
The average loss of these down days was -7.19%, similar to yesterday’s -7.6%. The average next day was +1.61%; as I write this the S&P 500 is up +1.3%. Most interesting is the final figure in the table: on average, the market was +6.2% higher six months after days like yesterday. But note the path isn’t straight up: if the average day-after gain is +1.61%, the fact that the market is up only 0.71% overall on average 3 months later means there’s often more turbulence ahead en route to that positive six-month result.
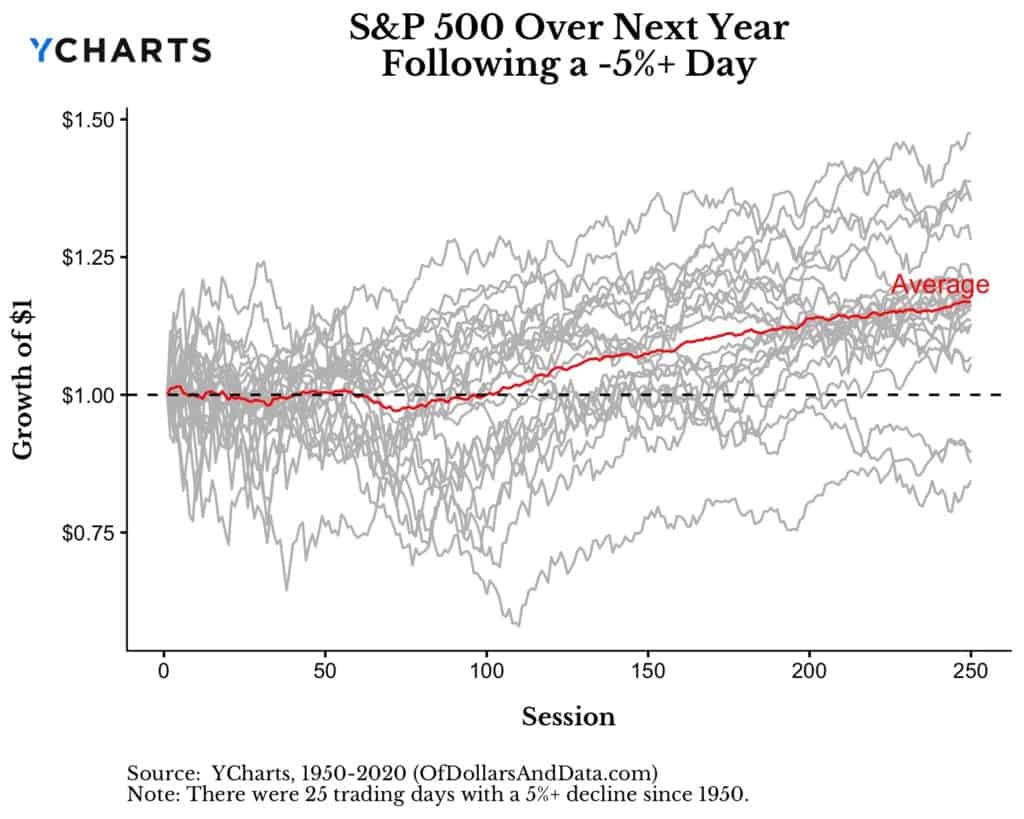
Nick Maggiulli’s post, referenced earlier, shows this historical pattern in a different way. (He’s got some other interesting charts in there too, so it’s worth reviewing the whole post.) His chart shows that on average, these big down days don’t exhibit a pattern for the first five months (roughly 100 sessions on his chart) — for every positive example, there’s an equally negative one to average it out. But as you get out beyond five months, that starts to change substantially.
Notice how few individual cases are left below the dotted break-even line as you get out beyond 200 market days toward the one-year mark. And the red average line shows stocks substantially higher one year after these big down days.
Click Graph to Enlarge
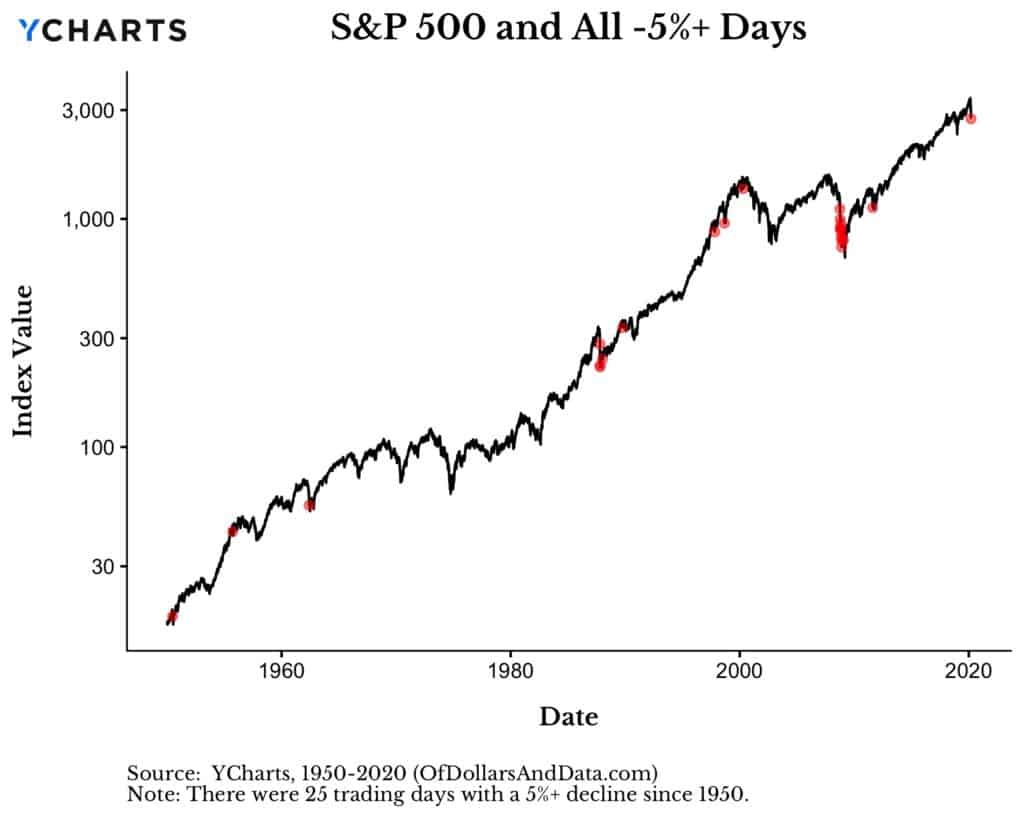
Before we get too nonchalant about what happened yesterday though, it’s worth noting when these big down days have occurred. Maggiulli helps with that as well:
Click Graph to Enlarge
That clustering around the 2008 bear market and 1987 crash isn’t comforting. Still, the message is consistent with what we’ve been saying about the SMI strategies since stocks started falling last month. That is, most of the time, we don’t want to completely take away all our upside market exposure at the first sign of trouble, because the vast majority of these sharp declines don’t turn into bear markets. That’s why Upgrading and Sector Rotation haven’t acted yet. However, because every bear market also looks like these corrections until it finally breaks out, we want some protection early on, which thankfully Dynamic Asset Allocation has provided already.
The fact that most corrections don’t turn into full-blown bear markets, coupled with the fact that even those that do become bear markets usually do so only after spending quite a bit of time battling through countertrend rallies, is why our strategies are purposely designed to respond slowly and in stages.