

I wanted to briefly touch base with everyone following this nasty week in the markets.
These nasty market stretches always seem to come at inconvenient times! Sorry I haven’t posted anything online this week — I’ve actually been writing all week, but it’s been for the February newsletter that goes out next Thursday. Here’s a quick weekend recap of what’s going on.
If you read the January cover article, Winds of Change Are Blowing: Casting a Wary Eye on 2022 (that we published right before Christmas) you already know that it’s not a huge shock that the market has hit some turbulence.
One of the themes of the year-in-review (that, unfortunately, won’t arrive until next week, as it’s in the February newsletter) is how totally disconnected the performance of the S&P 500 Index was from the rest of the stock market last year. And really, we can break that down even further, as the top seven tech stocks really carried that index all year.
Normally, bear markets are measured based on the S&P 500’s moves. A prolonged decline that takes that index down at least -20% is the normal bear market definition most investors use. By that measure, we’re not there yet, as the S&P 500 Index is down only -8.6% from its high. But much as "the market’s" performance last year wasn’t nearly as strong as the S&P 500 Index, this current downturn has been much nastier for the rest of the market than those largest stocks.
Let’s rip through some charts to show what’s going on.
First up is the S&P 500 Index dating back to the March 2020 bear market. I’ve included the 100-day moving average (red line) as well as the 200-day moving average. It’s easy to see that throughout this recovery, the S&P 500 has pulled back to the 100-day moving average a couple of times and bounced back higher. But until this week it hadn’t sniffed the 200-day moving average (which is a common divider between whether a stock or index is in a longer-term uptrend or downtrend).
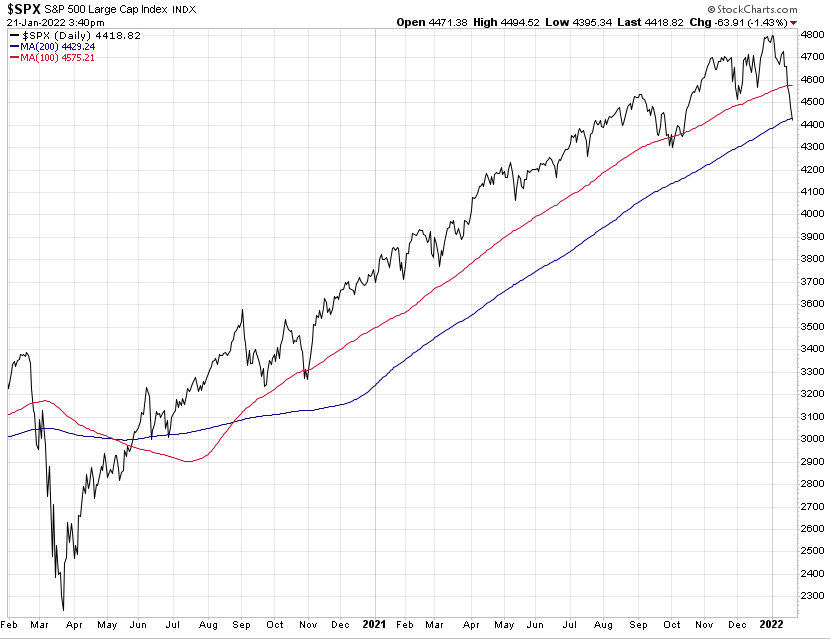
Click Chart to Enlarge
One optimistic note — if you were to look at a longer-term chart, it’s not terribly unusual for this index to pull back to the 200-day moving average and then bounce off it. This tends to happen a couple of times a year on average.
However, as I said earlier, the S&P 500 is the good chart. The rest of the market looks worse.
Here’s the Nasdaq tech index:
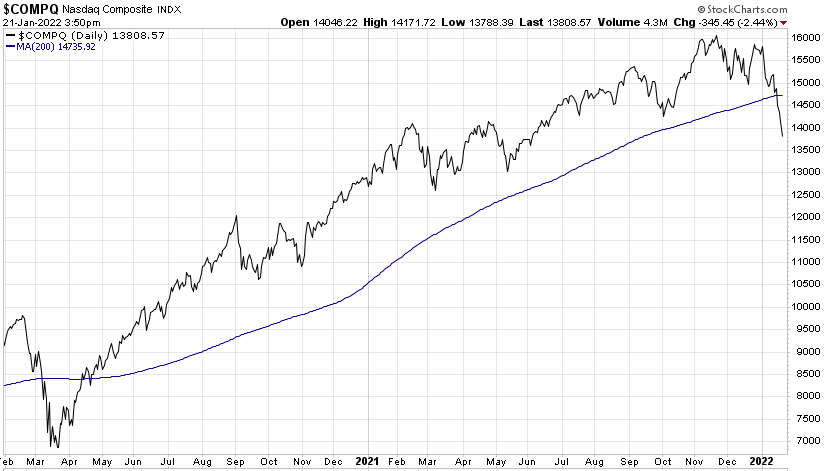
Click Chart to Enlarge
I didn’t bother including the 100-day moving average on this one, but the blue line is the 200-day moving average. Big tech stocks haven’t been close to that line until after September’s decline. (Which prompted me to write Beginning of the End, or Business as Usual?, in which I argued the bull market wasn’t over yet. You’ll note a distinctly different tone to this article from that one.)
The Nasdaq crashed through its 200-day moving average this week and is down -15% at this point.
Last up is the small-company Russell 2000 index. This chart dates back to November 2020 when the vaccine news lit a fire under small-company stocks. Since then, you can see they have declined to the zone indicated by the red box multiple times, but each time have rallied strongly off that level. Until this time.
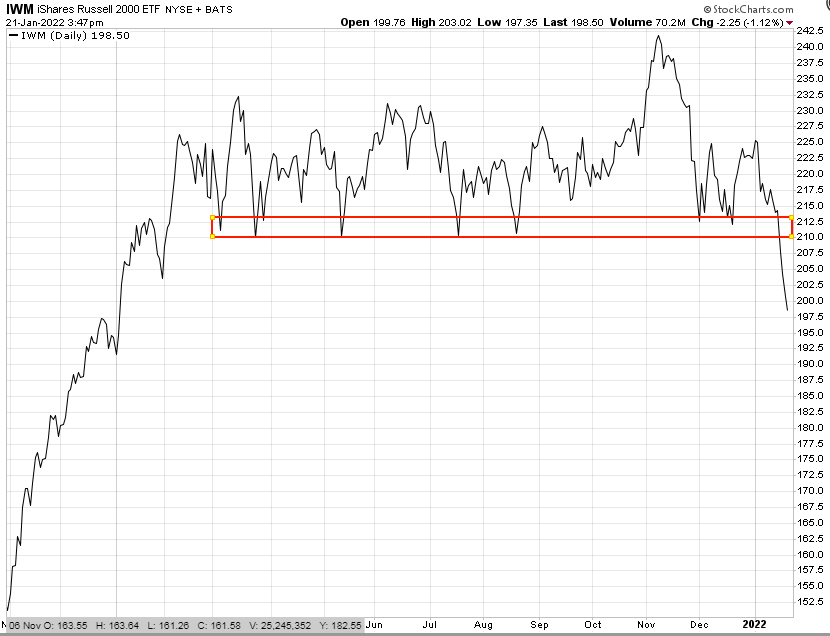
Click Chart to Enlarge
The Russell 2000 is down -19.2% from its November high. So it’s knocking on the door of official "bear market" territory.
Bear markets don’t usually go straight down
Last month’s cover was unusually direct about the risks we saw developing for the markets in 2022. I didn’t think it would necessarily unravel this fast, but the idea that stocks were very vulnerable was the whole point.
The reason the market has tumbled so quickly is really the same story we’ve been talking about in one form or another since last June. That was the first time the Fed indicated it was starting to pivot from super-easy policies toward tightening monetary conditions. Since then, we’ve had a series of pronouncements about tapering their asset purchases to end Quantitative Easing, plans to hike interest rates, and more recently there has even been talk regarding when it might be appropriate to think about Quantitative Tightening.
Throughout all of this, investors acted as if they didn’t care (or didn’t believe the Fed would actually follow through). Until suddenly, with the market now pricing in four rate hikes in 2022, they suddenly care. A lot.
The biggest thing I want to leave you with today is a reminder that bear markets are normally a process rather than an event. It’s easy to forget that because the last bear market in 2020 was an event — basically four weeks of straight-down terror and then it was over. Most bear markets aren’t like that.
Instead, here’s the typical pattern of a bear market:
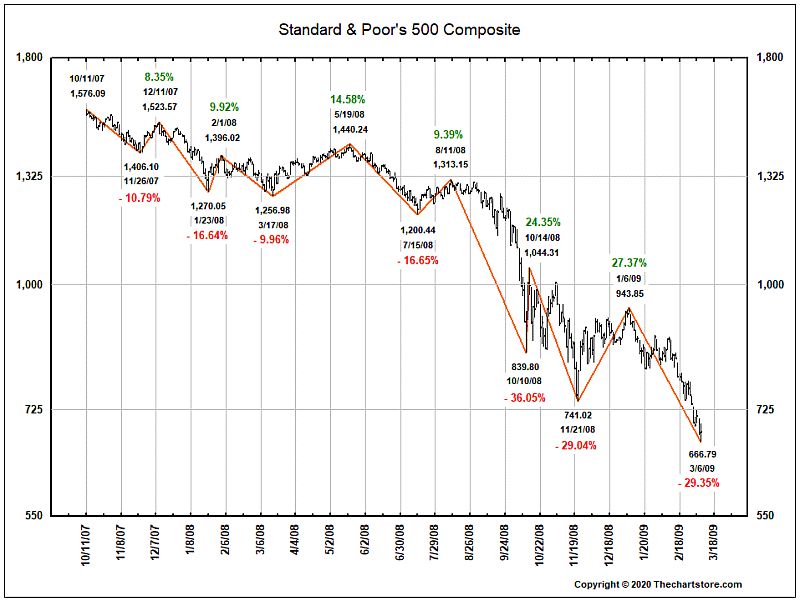
Click Chart to Enlarge
That’s the 2008 bear market, with each decline and counter-rally clearly marked. This back and forth, down and up and down again is the normal pattern.
This is super important because it helps us contextualize the S&P 500’s current -8.6% drop. Two of the first three down-legs of that 2008 bear market were pretty similar to what we’ve seen so far this year.
Of course, that doesn’t mean we’re heading for a full-blown bear market (though I think we are). And even if we are, it doesn’t mean it will mirror this past example.
But it’s not a coincidence that the market is having this fit immediately prior to next Wednesday’s Federal Reserve meeting. The market is voicing its displeasure at the current Fed policy. I expect Fed Chairman Powell to throw some sort of bone to the market next week — something along the lines of "We’re carefully watching economic and market indicators for signs that we need to adjust the rate and depth of Fed policy" that the market can take as a sign that it isn’t about to blindly crash this market.
If investors hear that, the market could easily bounce back strongly, as you see happened so often during the 2008 bear market. Bear markets are famous for counter-trend rallies.
And that’s why, at this point, I’d be hesitant to make big adjustments to a portfolio that make it dramatically more conservative. Next week’s newsletter will have more incremental defensive changes (and we may get some more at month-end when DAA updates). But we could easily see some of our current "growthier" holdings bounce back over the next week before we replace some of them.
Most importantly, remember that bear markets are part of the investing landscape. This one is particularly unpredictable, as so much seems to hinge on the Fed’s response to events. Eventually, I think they’ll cave and we’ll get more easing, at which point the market is going to fly higher again. I doubt we get that next week, because the Fed has to sound like they’re serious about fighting inflation.
But we can’t totally rule it out either, so our best approach is to stay on the path we’re on. That means we’ll continue getting incrementally more defensive as the danger signs increase. We started that way back in August last year when we cut our small-company stock exposure significantly. We continued that with a couple of additional moves a month ago. And we’ll have some more next week following this first leg of what might be the next bear market.