

The perception of most investors, based on the performance of the S&P 500 Index, is that “the market” soared in 2021 and ended the year near all-time highs. But as we’ll see, there’s a big difference between “the market” and the performance of the handful of largest stocks that dominate the S&P 500.
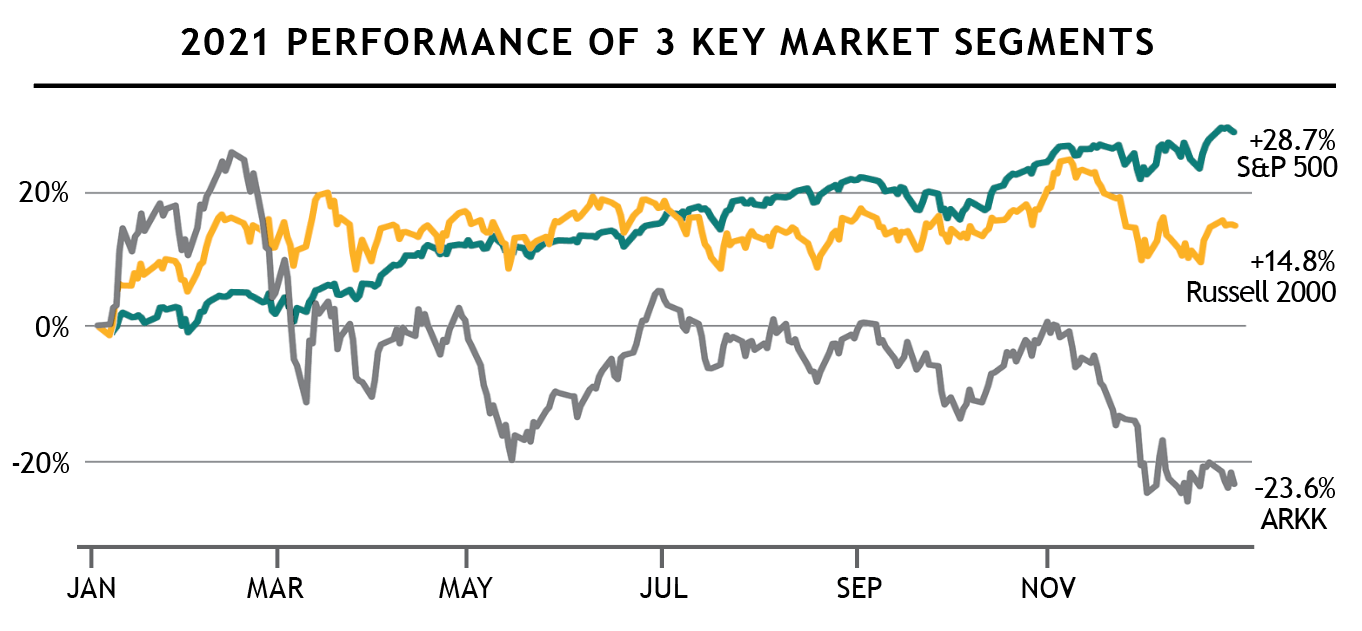
The graph below highlights the year-long performance of three important market segments.
The green line shows the performance of the large-company-focused S&P 500 Index. It took a couple of months to get rolling, but from March through year-end its performance was exceptionally strong, finishing with a 2021 gain of +28.7%.
The yellow line shows the performance of the Russell 2000 small-company index. Unlike the S&P 500, small-company stocks started 2021 quite strong. By mid-March, the Russell 2000 was already up +19.7%. But as the chart illustrates, the Russell 2000 was flat-to-lower for the rest of the year, finishing with a 2021 gain of just +14.8%. That’s roughly half the gain of the S&P 500 and considerably below its March high, meaning small company stocks declined for most of 2021 after the strong start.
The gray line isn’t one we would normally focus on, as it shows the performance of what we can loosely label “speculative tech” stocks, as exemplified by our prior Sector Rotation holding, ARKK. As the graph illustrates, these stocks peaked in mid-February — even earlier than the Russell 2000. From that February peak, these speculative tech stocks fell –39% through year-end.
We can glean several important points from contrasting the relative performance of these three market segments.
(Click Graph to Enlarge)
First, as the graph clearly illustrates, the common perception of 2021 being a great year for “the market” isn’t entirely accurate. It was great for the stocks in the S&P 500, but not for huge swaths of the U.S. market that peaked in the first quarter and then declined over the rest of the year. Foreign Stocks aren’t included in the chart, but they didn’t generate S&P 500 type returns either — the MSCI ACWI ex-USA index measuring foreign stocks gained just +7.8% in 2021.
To put it in a nutshell, stock performance in 2021 was divided between the S&P 500 Index on one hand and the rest of the market on the other.
But even within the S&P 500 Index, there was significant dispersion. At the end of 2021, while the S&P 500 Index was within 1% of its all-time high, the average stock in the index was nearly –12% below its individual 2021 high.
This disparity is possible due to the way the index is constructed. Because the S&P 500 Index is weighted by market capitalization, the largest stocks carry much more weight than the smaller ones. The seven largest tech stocks — Apple, Microsoft, Amazon, Google, Facebook, Tesla, NVIDIA — comprise nearly 25% of the index. (For reference, in 2010, the top seven S&P 500 stocks made up just 14% of the index and only three were tech stocks.)
Bluntly stated, the only way an investor could have achieved returns similar to the S&P 500 Index in 2021 was to be heavily invested in the handful of large tech stocks that dominate that index (whether by owning an S&P 500 index fund or otherwise).
We’ve seen this movie before in the late-1990s, the last time the S&P 500 Index had such an impressive three-year rate of return. Then, as now, tech stocks with swollen valuations dominated the index. Those of us of a certain age remember how that turned out. Those big tech stocks were the last to crack, but crack they did, falling –80% over the following three years and leading to a full decade of negative returns for the S&P 500 Index.
The point isn’t that the S&P 500 Index is bad — SMI members own it within Just-the-Basics and Dynamic Asset Allocation. Rather, it’s that the S&P 500 is incomplete. It’s an increasingly narrow measure of “the market” that has become driven by a handful of highly correlated “Big Tech” stocks. Unfortunately, many investors believe the S&P 500 still represents well-diversified exposure to the U.S. stock market. They could be in for a painful surprise.
The graph above also helps underscore the darkening outlook for markets that we discussed in January’s cover article, Winds of Change are Blowing: Casting a Wary Eye on 2022. Far from the strength implied by “all-time highs!” at year-end 2021, the graph illustrates that the market’s riskiest stocks (represented by ARKK) peaked and rolled over almost a year ago (February). The next riskiest group, small-company stocks, peaked in March and has gradually declined since. Only the S&P 500 Index closed 2021 near its all-time high, propped up by a tiny fraction of its largest constituents.
(Click Table to Enlarge)
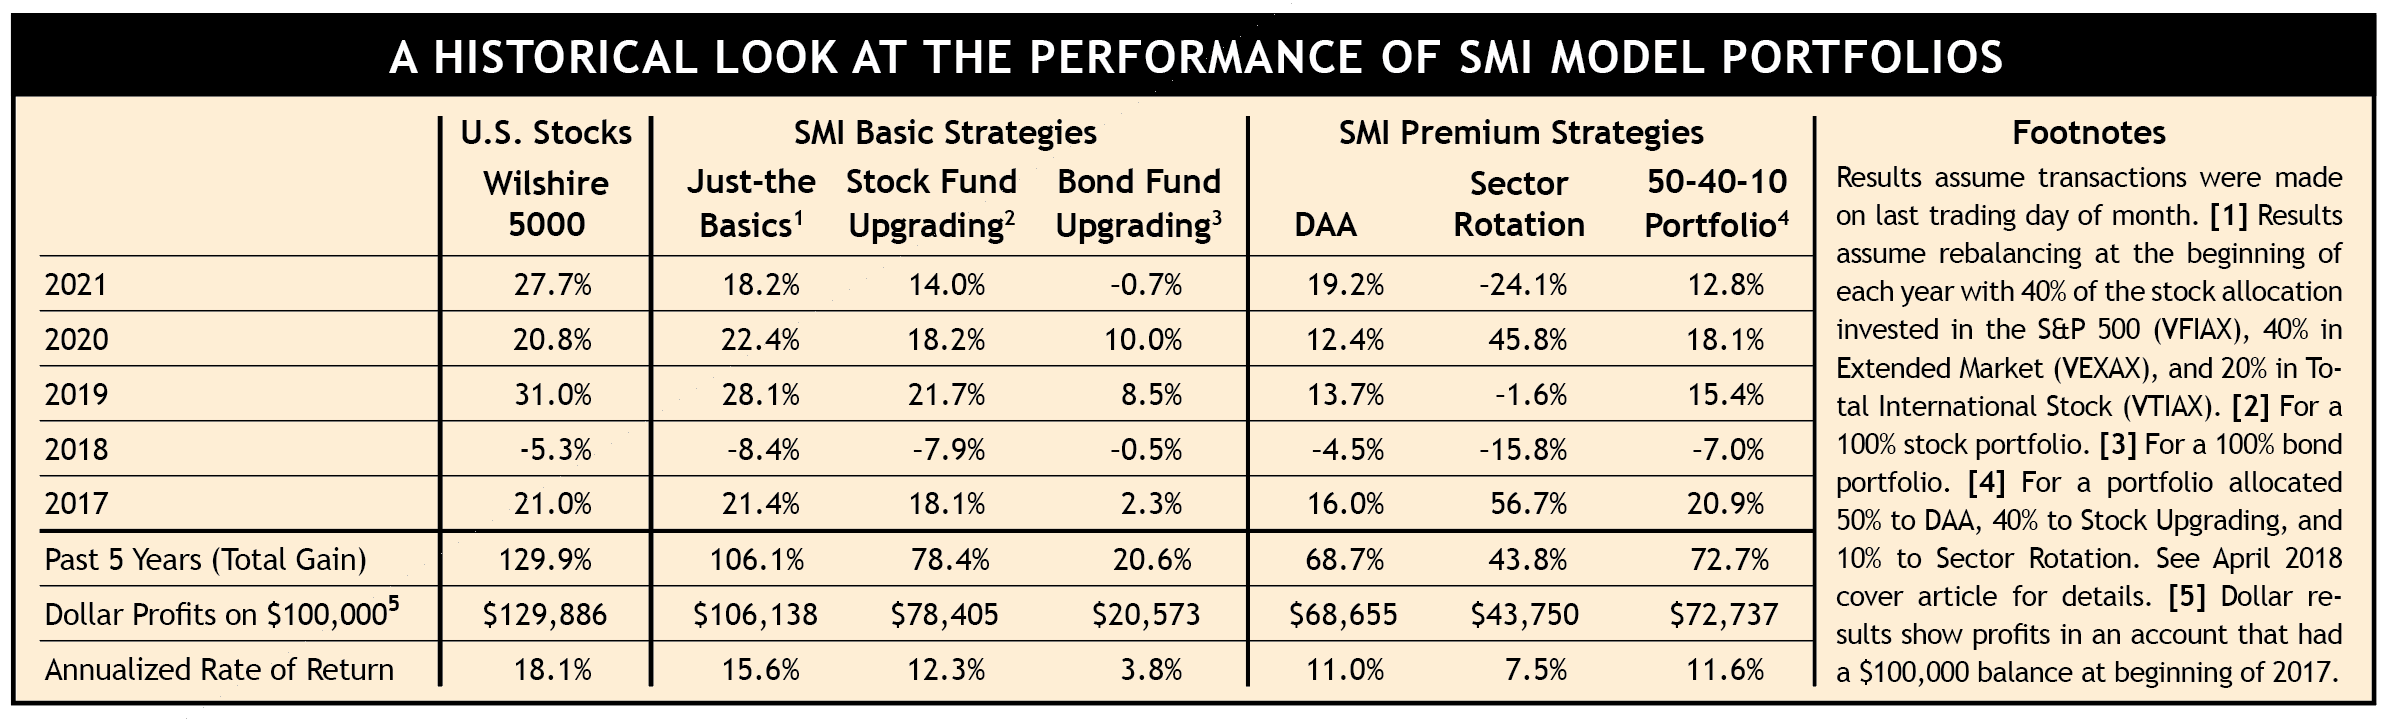
Just-the-Basics (JtB) & Stock Upgrading
The disparity in returns between the three JtB stock-fund components reinforces the points we’ve been discussing. JtB’s S&P 500 component was strong, gaining +28.7%. Its smaller-stock component gained less than half that at +12.5%. And bringing up the rear were foreign stocks, at +8.6%.
Fund Upgrading did some things better than JtB and other things worse. On the positive side, we avoided foreign stocks for most of 2021 while adding commodities, which gained +26% — despite this allocation being in cash from July-October.
On the negative side, the highly unusual dynamics of the COVID pandemic worked against Upgrading’s trend-following processes. Throughout the 2020 lockdowns, large/growth stocks dominated the market action, so Stock Upgrading was overweighted in those stocks as 2021 began. As the graph at the beginning of the article illustrates, small-company stocks raced out to huge early gains while large stocks lagged during the first two months of the year. Upgrading’s trend-following process led us into those small-company stocks in March…just as small-company stocks peaked and leadership rotated back to large-company stocks. So while Stock Upgrading’s gain of +14.0% was strong in an absolute sense, we would have expected even better performance.
Thankfully, these pandemic dynamics appear to be receding and we have every reason to believe the modifications made to Stock Upgrading at the beginning of 2021 will pay off in the future.
Bond Upgrading
Bond Upgrading made the best of a bad situation in 2021. With interest rates trending higher throughout the year, there weren’t any great options for bond investors. The Bloomberg U.S. Treasury Index was down –2.3% in 2021, the fifth-worst year on record (dating back to 1973). Against this difficult backdrop, Bond Upgrading was positioned in the better performing options for most of the year. Its loss of –0.7% was better than the Treasury Index or the Bloomberg Aggregate U.S. Bond Index loss of –1.5%.
Dynamic Asset Allocation (DAA)
Aside from SMI’s new commodities allocation in Stock Upgrading, Dynamic Asset Allocation was the biggest positive surprise, gaining +19.2%. (That number drops to roughly +15.1% if the optional refinements outlined last April were implemented as detailed in the monthly DAA updates throughout 2021. Those optional refinements were hurt by the same whipsaws that impacted Stock Upgrading last year.)
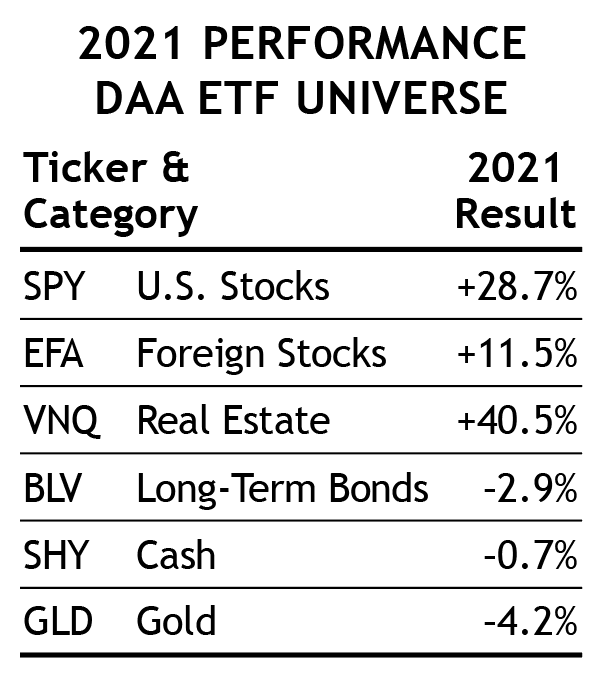
DAA spent most of 2021 invested in U.S. Stocks, Foreign Stocks, and Real Estate, all of which contributed solid performance overall. As strong as U.S. Stocks were last year, Real Estate was even more impressive.
As the nearby table shows, 2021 was a year of stark performance disparity between the asset classes that were working for investors and those that weren’t. This unexpectedly strong performance from DAA, which pushed the portfolio to new all-time highs by year-end, helped offset weaker-than-expected performance from SMI’s typical bull market star, Sector Rotation.
Sector Rotation (SR)
Sector Rotation was the biggest problem for SMI portfolios last year, falling –24.1%. ARKK, which we used to demonstrate “speculative tech” in the chart on page 24, helped SR capture a +45.8% gain in 2020, but it gave back a lot of those gains in 2021. This experience prompted a thorough review of our SR process, leading to the changes we revealed in the September 2021 newsletter. We believe those modifications will help reduce downside risk in the future.
50/40/10
This portfolio refers to the specific blend of SMI strategies — 50% DAA, 40% Upgrading, 10% Sector Rotation — discussed in our April 2018 cover article, Higher Returns With Less Risk, Re-Examined. It’s a great example of the type of diversified portfolio we encourage most SMI readers to consider. (Blending multiple strategies adds complexity. Some SMI members may prefer an automated approach such as that offered by SMIPrivateClient.)
A 50/40/10 portfolio would have advanced +12.8% in 2021, assuming the entire Upgrading portion was invested in Stock Upgrading. While that’s not as large a return as we would have preferred, it’s still a solid annual gain that pushed the 50/40/10 portfolio to new all-time highs. With bonds experiencing one of their worst years ever and many segments of the stock market (outside of the top S&P 500 holdings) struggling to some degree, achieving strong positive returns while maintaining an appropriate degree of diversification wasn’t as easy as the S&P 500’s attention-grabbing return might indicate.
As we detailed in last month’s cover article, rougher markets seem likely in 2022. Every couple of decades, it seems investors have to re-learn the hard lessons of prior generations. This isn’t the first time investors have put their faith in a relative handful of stocks they perceive to be bullet-proof: the “Nifty Fifty” in the early 1970s and the “Tech Darlings” of the late 1990s share many characteristics with the “Big Tech” stocks that are currently supporting the broad market indexes. Unfortunately, history shows that even excellent companies aren’t immune to market gravity when their valuations swell too much and market conditions turn sour. We can reduce the risks present in today’s market conditions through an appropriate degree of diversification. Portfolios constructed using a blend of SMI’s strategies are an effective way to accomplish that.