

The stock market started the first quarter with a bang, extending the 2017 rally with a January gain of +5.7%. But an unexpected bump in February’s wage-inflation report rattled investors, producing a surge in volatility and ushering in the first “correction” (a decline of 10% from a prior high) in two years.
While stocks quickly recovered much of the ground from that February correction, volatility has remained high. In 2017, stock prices moved 1% or more in a day only eight times. By early April of 2018, the market had already experienced 28 such days. This volatility spike has felt particularly jarring given the long stretch of record-breaking low volatility that preceded it.
Given that January’s action was so different from the rest of the quarter, the cumulative results can be a bit misleading. For example, the -1.0% first-quarter loss for the S&P 500 seems mild enough, but belies the fact that it was up big in January (+5.7%), then down -3.7% in February and -2.5% in March.
In many respects, the end of the first quarter found the financial markets at an inflection point of sorts. The stock market was testing its longer-term trend lines, but hadn’t broken through them. Many consider those trend lines an indication of whether the overall trend is positive or negative, so a break below would potentially indicate a “regime change” from last year’s uptrend. Meanwhile, a similar situation developed for bonds with 10-year Treasury yields rising to near the 3% level that some consider to be a turning point, but then backing off. For both stocks and bonds, the longer-term trends remain intact, but under pressure.
Just-the-Basics (JtB) & Stock Upgrading
Both JtB and Stock Upgrading beat the broad market in the first quarter. JtB lost -0.3% overall, while Upgrading was off -0.1%. Both were aided by their positions in foreign stocks, which continued their strong performance of the past year. The U.S. dollar has been weak relative to other currencies, which boosts the returns U.S. investors get from foreign-stock holdings.
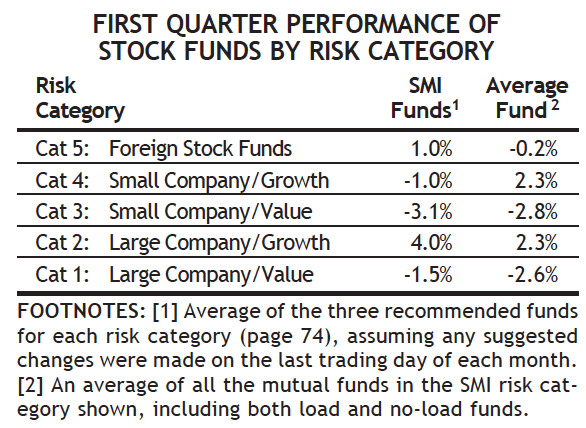
The other trend worth noting has been the domination of growth stocks over value. In the first quarter, both small- and large-growth stocks had roughly a 5% advantage over their corresponding value counterpart (this is more obvious in the “Average Funds” column of the table at right). Over the past year, this advantage has reached about 14% for each growth group over its value counterpart. The situation is reminiscent of the end of the 1990s bull market — the only other time in history that stock market valuations have been as high as they are today.
Bond Upgrading
Inflation is the mortal enemy of bond investors, so its return as a potential foil — after a decade of being completely off the table as deflation concerns reigned — rattled bond markets. All of the funds that Bond Upgrading tracks posted negative first-quarter returns, indicating there wasn’t anywhere to hide. (One bright spot: as of April 11, the lone positive 3-month return in our Bond Upgrading universe belonged to our current recommendation. So at least we’ve been as well-positioned as possible since the bond landscape shifted in early February.) Bond Upgrading’s loss of -1.4% for the quarter was slightly ahead of the -1.5% declines of both the Barclays U.S. Aggregate Bond Index and Vanguard’s U.S. Total Market Bond fund.
The Federal Reserve hiked interest rates for the sixth time in this cycle on March 21, boosting the short-term rate to 1.50%-1.75% (they target a range now, rather than a specific number). While that’s still a low rate by historical standards, it’s a considerable boost that is transforming the short-end of the interest-rate curve. Consider the 2-year Treasury bond, which yielded 0.2% five years ago but is now up to 2.3%. And the Fed has clearly stated more rate hikes are forthcoming, with the market expecting at least three, if not four, total hikes this year. This means continued pressure on bond prices as yields “normalize” toward higher levels. As such, we don’t feel this is the time to be taking any risks in the bond portion of our portfolios.
Dynamic Asset Allocation (DAA)
DAA’s total return of -1.8% may seem lackluster, but it masks the two distinct performance periods within the quarter, each of which provided about what we would have expected from DAA.
In January, when stocks were up big, DAA lagged — as it often will in strong markets. But when stocks suffered significant losses in February and again in March, DAA held up much better than the market. In March, for example, the S&P 500 was down -2.5% while DAA dropped just -1.0%.
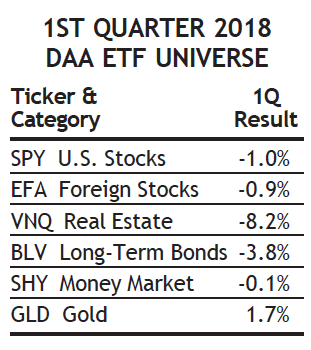
As is often the case, what DAA avoids is often as important as what it owns. As the table at right shows, by avoiding real estate completely, and getting out of bonds at the end of January—just before the big inflation surprise roiled the bond market in early February — DAA was able to sidestep the worst performing classes this quarter.
Sector Rotation (SR)
SR posted another strong gain in the first quarter, gaining +8.7%. But as with the other strategies we’ve discussed, there’s more to that number than meets the eye. SR posted a dramatic +11.0% gain in January, eked out a +0.8% gain in February, and fell -2.9% in March.
But even those numbers fail to communicate the full story of SR’s wild first quarter ride. After hitting a new high on January 26, SR proceeded to drop -17.8% over the next nine trading days. From that point, on February 8, it then staged a furious +29.1% rally to a new high on March 12 — only to then drop -17.6% over the following month before bottoming on April 6. This is the sort of volatility SMI constantly warns investors they must be willing to tolerate to obtain SR’s outstanding long-term returns. If you can’t stick with SR when the markets fall, the headlines are scary, and your holding appears to be headed to zero, it’s not for you!
50/40/10
This portfolio refers to the specific blend of SMI strategies — 50% DAA, 40% Upgrading, 10% Sector Rotation — discussed in our April 2018 cover article, Higher Returns With Less Risk, Re-Examined. It’s a great example of the type of diversified portfolio we encourage most SMI readers to consider. As we’ve seen repeatedly in recent years, the markets can shift suddenly between rewarding risk-taking and punishing it, so a blend of higher-risk and lower-risk strategies can help smooth your long-term path and promote the type of emotional stability that breeds sustained investing success.
A 50/40/10 portfolio would have lost only -0.1% during the first quarter, considerably less than the broad market. While the SR component was dramatically up and down (en route to significant overall gains), the DAA component would have provided an emotional offset, losing less when the rest of the market was at its worst. Overall, the first quarter provided a good illustration of how trading off both return and volatility among the various strategies can produce a smoother ride and solid overall returns. Whether you’re using this specific 50/40/10 blend or a different combination, we think most SMI readers can benefit from blending these strategies in some fashion. (Blending multiple strategies adds complexity. Some members might want to use an automated approach.)